
Article Categories
- All Categories
-
 Data Structure
-
 Networking
-
 RDBMS
RDBMS
-
 Operating System
-
 Java
Java
-
 MS Excel
-
 iOS
iOS
-
 HTML
HTML
-
 CSS
CSS
-
 Android
-
 Python
-
 C Programming
-
 C++
C++
-
 C#
C#
-
 MongoDB
-
 MySQL
MySQL
-
 Javascript
-
 PHP
PHP
-
 Economics & Finance
How to conduct the F test Two sample for Variances using the Data Analysis Tab?
You will discover how to perform an F test using Data Analysis Toolpak in this article. The Ftest function would be used to verify whether two distinct samples have the same variances or not. Manually doing the F test has a significant probability of error, is timeconsuming, and yields erroneous findings. After conducting the F test, users may decide whether to accept the null hypothesis or reject the alternative hypothesis. It is one of the best statistical methods and generates accurate results when dealing with numerous samples in a dataset.
To conduct FTest of two samples for Variances without mathematical equation
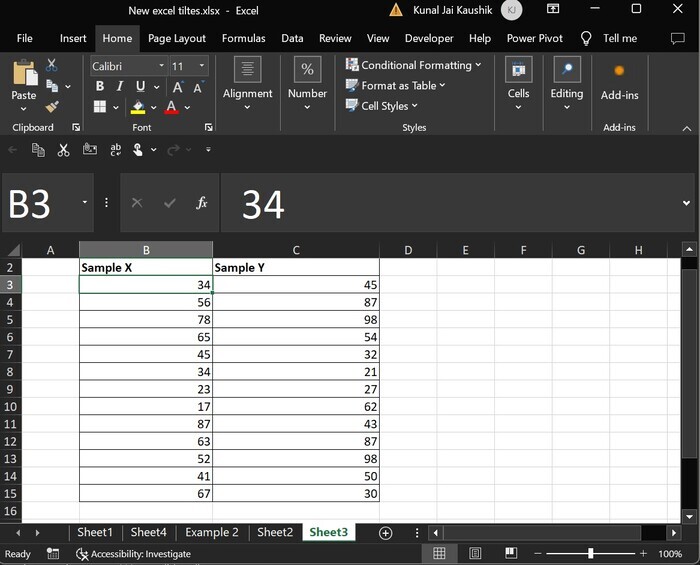
Step 1 Open the new worksheet and enter the sample dataset as shown in below image
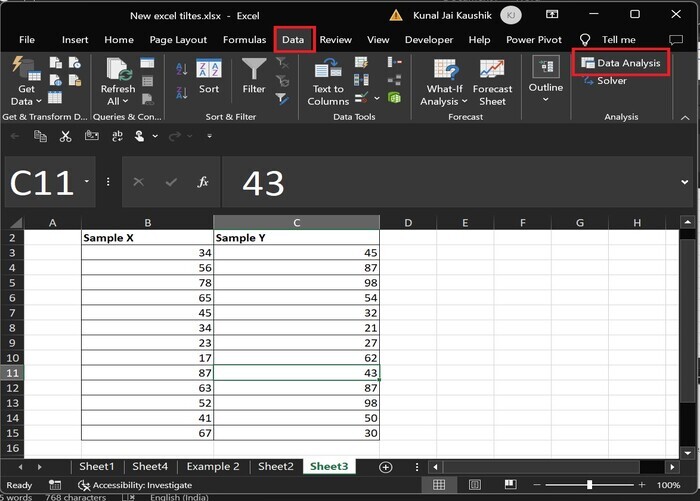
Step 2 Switch to the Data tab and click on the Data Analysis option to perform F test
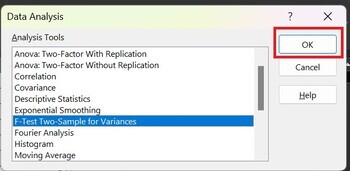
Step 3 Another Data Analysis dialog box will appear. Choose the "FTest TwoSample for Variances" option from the dropdown list. And then click on the OK button.
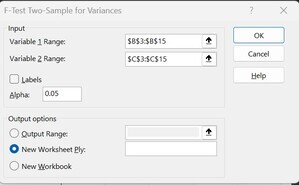
Step 4 Enter the range of sample 1 in the textbox adjacent to the "Variable 1 Range:" label and write the range of sample 2 in the "Variable 2 Range" textbox. Set the value of Alpha to 0.05 and choose the "New Worksheet Ply:" option which means the output is displayed in a new worksheet. After that click on the OK button.
Step 5 Therefore, the Ftest output is generated in another new worksheet named Sheet5.
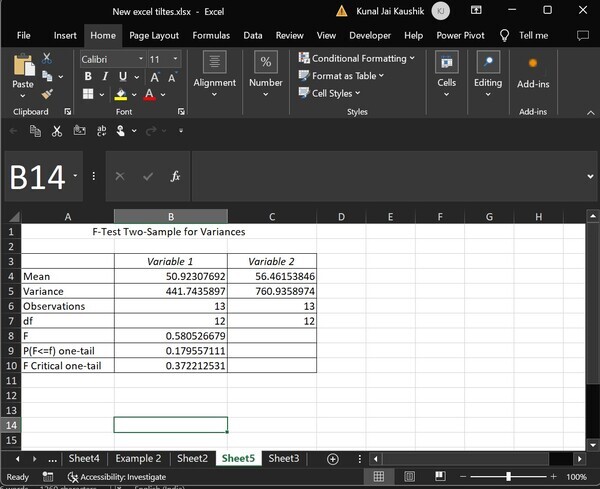
Explanation of Output table
There is a variation in the Mean of Variable 1 and Variable 2 as shown in the fourth row of the above table.
In the fifth row, the Variance of the two samples is distinct representing the variation in two data sets.
In the sixth row of the above image, the Observations denote only 13 data points that would be used in conducting the Ftest.
The value of df(degree of variation) is 12.
In the 9th row, the probability distribution of both samples is 0.179(18% approx.)
As you see the B8 and B10 cell values, which depict F value>F Critical onetail Mathematically, 0.58052>0.37221, means rejecting the null hypothesis and accepting the Alternative Hypothesis.
Conclusion
Managing large numbers of datasets becomes more manageable when using efficient methods like those mentioned above. To undertake the statistical method through the data analysis tool in Excel, users need to learn the proper installation of the Data Analysis toolpak. After installation, users would see the visibility of the Data Analysis option under the Analysis ribbon depicted inside the Data tab.

385 Views
