
 Data Structure
 Networking
 RDBMS
RDBMS Operating System
 Java
Java MS Excel
 iOS
iOS HTML
HTML CSS
CSS Android
 Python
 C Programming
 C++
C++ C#
C# MongoDB
 MySQL
MySQL Javascript
 PHP
PHP
- Selected Reading
- UPSC IAS Exams Notes
- Developer's Best Practices
- Questions and Answers
- Effective Resume Writing
- HR Interview Questions
- Computer Glossary
- Who is Who
Data Analysis with Spreadsheets
Cleansing, transforming, and analyzing raw data is the first step in the process of obtaining useful, pertinent information which can help businesses make informed conclusions.
By offering relevant information and facts, which are usually presented as charts, pictures, tables, and graphs, the strategy helps to lower the risks associated with decision-making.
Data analysis is concerned with the process of converting unprocessed data into pertinent statistics, knowledge, and explanations.
Data analysis is a crucial competence that may support better decision-making.
Spreadsheets are the most often used tools for data analysis, and built-in pivot tables are the most popular analytical tool.
Functions for Data Analysis in Spreadsheets
Spreadsheets include hundreds of functions, so it can be difficult to try matching the right formula with its right kind of data analysis. The most important functions don't necessarily have to be the hardest to do. Let us discuss some simple functions that will improve your data interpretation skills.
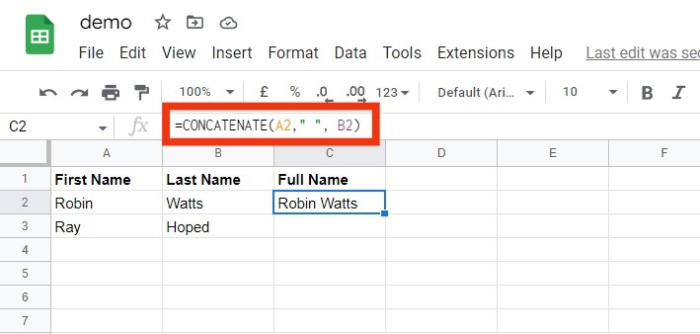
Concatenate()
One of the easiest to comprehend yet most effective formulas for data analysis is =CONCATENATE. Every single cell can contain numbers,text, dates, and many other information from multiple cells.
Syntax
CONCATENATE (string1, string2, [string3], ...)
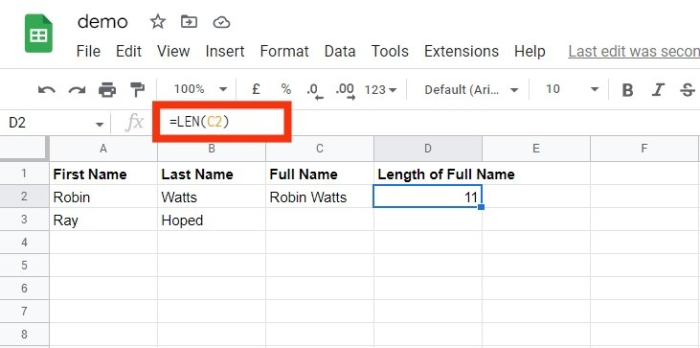
Len()
LEN() function is used to display total number of letters present in every cell. It is typically used while trying to distinguish between product numbers or when we are working with content that has a character limit.
Syntax
SYNTAX = LEN (text)
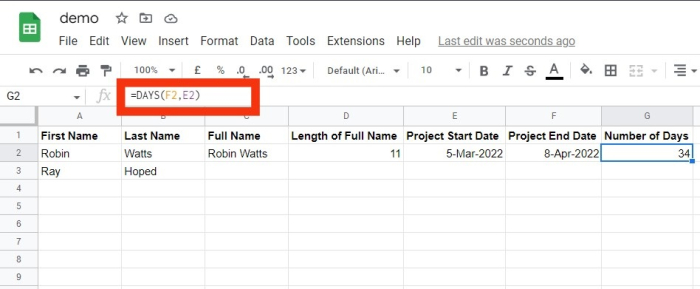
Days()
This function = DAYS can be used to determine how many calendar days there are between two dates.
Syntax
DAYS (from_date(ending date), to_date(starting date))
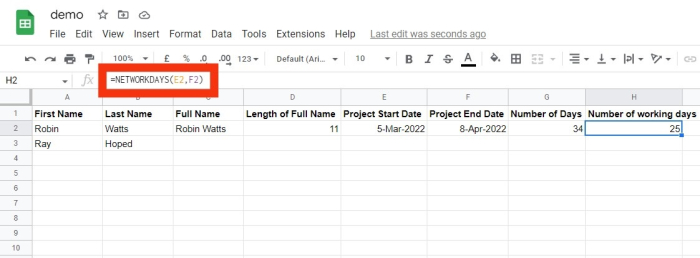
Networkdays()
Networkdays falls under the category of Date/Time in spreadsheets. Whenever this function is called, the count of weekends is implicitly omitted.
The networkday function is used in accounting and finance. A simple use case can be determining employees' benefits based on the number of days worked, the number of business days required to fix a consumer's problem or the number of working days available during a project.
Syntax
NETWORKDAYS (starting_date, ending_date, [list of holidays])
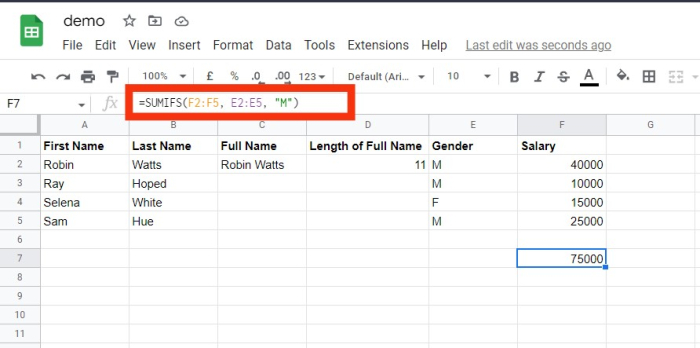
Sumifs
=SUMIFS() is one of the "must to know" formulas for data analysis used by many data analysts.
The formula =SUM is well known, but iif we need to sum data based on multiple factors,
we can use SUMIFS().
Syntax
SUMIFS (range of sum , range_1, test_1, [range_2], [test_2], ...)
Here in place of test_1,test_2 you may input the different criteria.
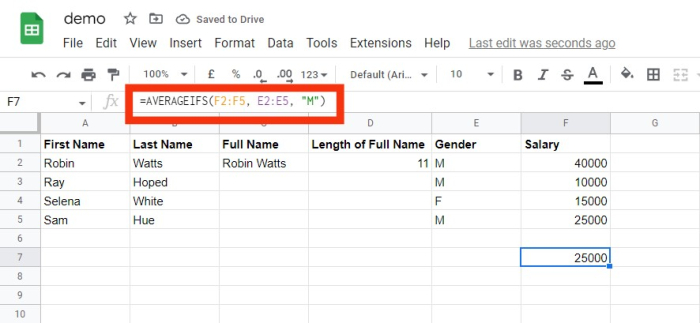
Averageifs()
Similar to SUMIFS, AVERAGEIFS() enables you to calculate an average which is based on parameters. These parameters can be one or more than one.
Syntax
AVERAGEIFS (average_range, range_1, test_1, [range_2], [test_2], ...)
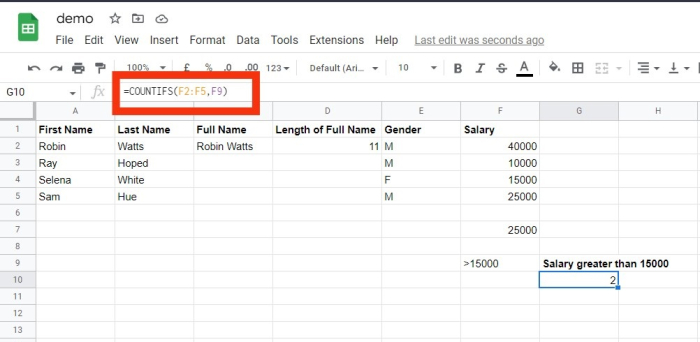
Countsifs ()
One more effective tool for data analysis using Spreadsheets is the COUNTIFS() function.
It mimics the SUMIFS function a lot.
The COUNTIFS() function keeps track of how many values meet a given set of criteria.
It does not, therefore, require a range like that in SUMIFS.
COUNTIFS (range, criteria)
Counta()
A cell's status as empty is determined by COUNTA.
As a data analyst, you will encounter incomplete data sets frequently.
You can investigate any gaps in the dataset using COUNTA without having to rearrange the data.
Syntax
COUNTA (value1, [value2], ...)
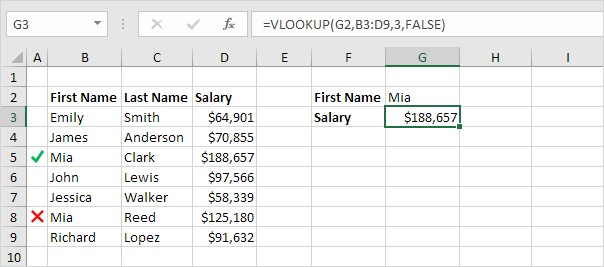
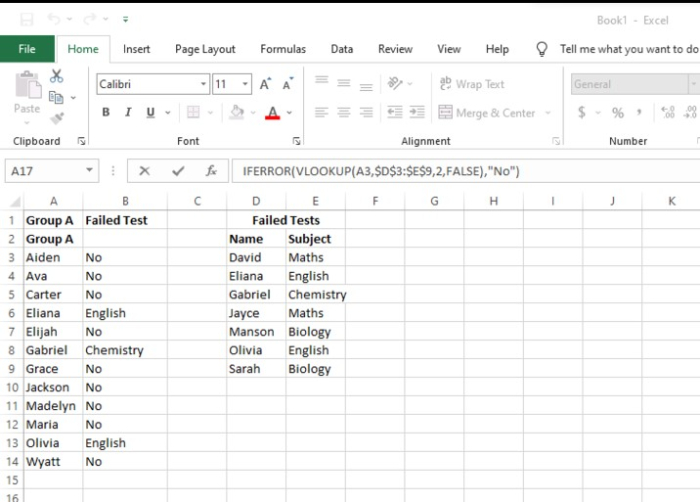
Vlookup()
Vertical Lookup is the meaning of the abbreviation VLOOKUP.
This function instructs Spreadsheets to search for a explicit value in a column (the referred to as a "table array") to retrieve an item from a different col present in the same row.
VLOOKUP (item for lookup, matrix , col_indx_number, [lookup_rng])
Hlookup()
HLOOKUP stands for horizontal lookup. It is used whenever we want to search data in a row which is across the top of a table. Hlookup can also look in a specific number of rows in the database.
HLOOKUP (index for lookup, matrix, row_index_number, [lookup_rng])
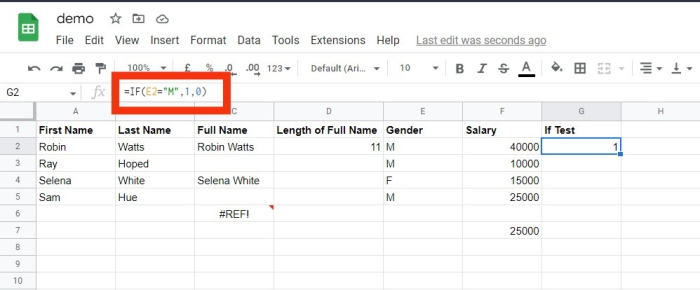
If()
The IF function is quite useful.
With the help of this feature, we may make decisions on our spreadsheets automatically.
Depending on the outcome of a logical test, we could use IF() to instruct Spreadsheet to do a new calculation or display a different value.
In the IF() function, a test will be performed, and the outcomes will be fed beforehand for both the outcomes; i.e. if the test is successful or unsuccessful;
E.g. Let us take an example where we want to decide if a number is even or not .
The logical test here will be calculating the remainder of the number when dividing by 2.
If the remainder is 0, the answer will be true, otherwise the answer will be false.
IF (test, [ans_if_test_successful], [ans_if_test_unsuccessful])
Locate/Search
Spreadsheets's FIND function gives the location of one string inside of another string (present as a number).
If the text cannot be found, the FIND command returns a #VALUE error.
However, a =SEARCH for "Bigger" will expand the scope of the query by returning results for Bigger or bigger.
If you're looking for abnormalities or special IDs, this is quite useful.
Syntax
FIND (text to find, string in which you want to search,
[starting_number])
Syntax
SEARCH (text to find, string in which you want to search,
[starting_number])
The Left/Right
Simple and effective methods for obtaining static data from cells are =LEFT and =RIGHT.
While =LEFT will return the "x" number of letters from the current cell start, =RIGHT will return the "x" number of letters from current cell end.
LEFT (txt, [num of characters])
RIGHT (txt, [num of characters])
Rank()
Despite being an outdated Spreadsheets function, =RANK is still helpful for data analysis. A dataset's values can be quickly ranked in either ascending or descending order using the =RANK function. In this instance, RANK is being used to identify the customers who place the most orders.
SYNTAX = RANK (number, ref, [order])
Iferror()
By using IFERROR, we may perform a different calculation or even report a more detailed error than Excel does. The IFERROR function needs two things in order to function. What value needs to be verified for errors, and what should be done in its place.
SYNTAX = IFERROR (value, value_if_error)
Conclusion
Spreadsheets are the most often used tools for data analysis. In this article we learned about various functions of spreadsheets used for data analysis with their syntax and output. We hope this article helped you in enhancing your knowledge of spreadsheets.

952 Views
