
Article Categories
- All Categories
-
 Data Structure
-
 Networking
-
 RDBMS
RDBMS
-
 Operating System
-
 Java
Java
-
 MS Excel
-
 iOS
iOS
-
 HTML
HTML
-
 CSS
CSS
-
 Android
-
 Python
-
 C Programming
-
 C++
C++
-
 C#
C#
-
 MongoDB
-
 MySQL
MySQL
-
 Javascript
-
 PHP
PHP
-
 Economics & Finance
How to move the x-axis to top in a JavaFX line chart?
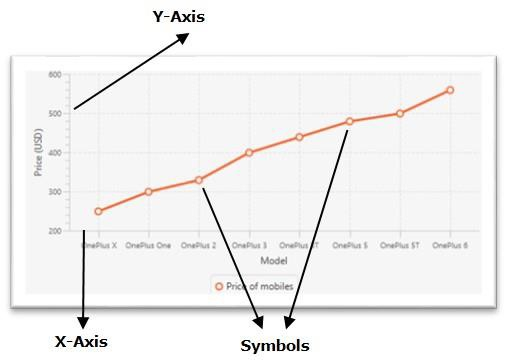
Inline chart, the data values have represented a series of points connected by a line. In JavaFX, you can create a line chart by instantiating the javafx.scene.chart.LineChart class.
By default,
A JavaFX Line chart contains symbols pointing out the values in the series along the x-axis. Typically, these are small circles.
The X-Axis on the bottom in the plot.
Y-Axis on the left.
Moving the X-Axis to top
The Axis class (superclass of all axes) has a property named side, this specifies the side of the plot at which you need to have the current axis (left, right, top-bottom). You can set the value to this property using the setSide() method. This method accepts one of the following values as a parameter −
Side.BOTTOM
Side.TOP
Side.LEFT
Side.RIGHT
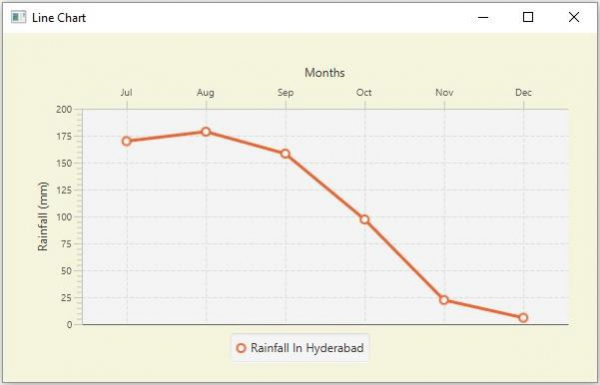
To move the X-Axis to top, invoke the setSide() method on the object of the XAxis of your plot by passing the value Side.TOP as a parameter.
Example
import javafx.application.Application;
import javafx.geometry.Insets;
import javafx.geometry.Side;
import javafx.scene.Scene;
import javafx.stage.Stage;
import javafx.scene.chart.CategoryAxis;
import javafx.scene.chart.LineChart;
import javafx.scene.chart.NumberAxis;
import javafx.scene.chart.XYChart;
import javafx.scene.layout.StackPane;
public class LineChartAxisShift extends Application {
   public void start(Stage stage) {
      //Defining the x an y axes
      CategoryAxis xAxis = new CategoryAxis();
      NumberAxis yAxis = new NumberAxis();
      //Setting labels for the axes
      xAxis.setLabel("Months");
      yAxis.setLabel("Rainfall (mm)");
      //Creating a line chart
      LineChart linechart = new LineChart(xAxis, yAxis);
      //Preparing the data points for the line1
      XYChart.Series series = new XYChart.Series();
      series.getData().add(new XYChart.Data("Jul", 169.9));
      series.getData().add(new XYChart.Data("Aug", 178.7));
      series.getData().add(new XYChart.Data("Sep", 158.3));
      series.getData().add(new XYChart.Data("Oct", 97.2));
      series.getData().add(new XYChart.Data("Nov", 22.4));
      series.getData().add(new XYChart.Data("Dec", 5.9));
      //Setting the name to the line (series)
      series.setName("Rainfall In Hyderabad");
      //Setting the data to Line chart
      linechart.getData().add(series);
      //Shifting the X-axis
      xAxis.setSide(Side.TOP);
      //Creating a stack pane to hold the chart
      StackPane pane = new StackPane(linechart);
      pane.setPadding(new Insets(15, 15, 15, 15));
      pane.setStyle("-fx-background-color: BEIGE");
      //Setting the Scene
      Scene scene = new Scene(pane, 595, 350);
      stage.setTitle("Line Chart");
      stage.setScene(scene);
      stage.show();
   }
   public static void main(String args[]){
      launch(args);
   }
}
Output

542 Views
