
Article Categories
- All Categories
-
 Data Structure
-
 Networking
-
 RDBMS
RDBMS
-
 Operating System
-
 Java
Java
-
 MS Excel
-
 iOS
iOS
-
 HTML
HTML
-
 CSS
CSS
-
 Android
-
 Python
-
 C Programming
-
 C++
C++
-
 C#
C#
-
 MongoDB
-
 MySQL
MySQL
-
 Javascript
-
 PHP
PHP
-
 Economics & Finance
How to change the color of X and Y axis lines in a JavaFX char?
The javafx.scene.chart package provides classes to create various charts namely &minusl line chart, area chart, bar chart, pie chart, bubble chart, scatter chart, etc.
Except for pie chart, all other charts are plotted on the XY planes. You can create the required XY chart by instantiating the respective class.
Changing the color of axis lines −
The fx-border-color class of JavaFX CSS is used to set the color of the border of a node.
The -fx-border-width class of JavaFX CSS is used to set the width of the border of a node.
The setStyle() method of the Node (Base class of all the nodes) class accepts a CSS string and sets the specified style to the current chart.
To change the color of the x and y axes (to OrangeRed), set the following CSS to the chart object using the setStyle() method −
fx-border-color: OrangeRed transparent transparent; -fx-border-width:3
-fx-border-color: transparent OrangeRed transparent transparent; -fx-borderwidth:3
Example
import javafx.application.Application;
import javafx.scene.Scene;
import javafx.stage.Stage;
import javafx.scene.chart.LineChart;
import javafx.scene.chart.NumberAxis;
import javafx.scene.chart.XYChart;
import javafx.scene.layout.StackPane;
public class ChangingAxisColor extends Application {
public void start(Stage stage) {
//Defining the x axis
NumberAxis xAxis = new NumberAxis(1960, 2020, 10);
xAxis.setLabel("Years");
//Defining the y axis
NumberAxis yAxis = new NumberAxis (0, 350, 50);
yAxis.setLabel("No.of schools");
//Creating the line chart
LineChart<Number,Number> linechart = new
LineChart<Number,Number>(xAxis, yAxis);
XYChart.Series<Number,Number> series = new XYChart.Series<Number,Number>();
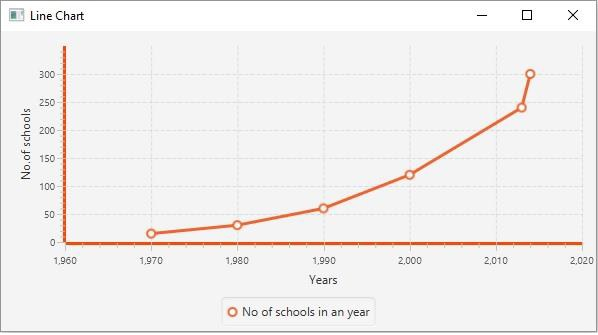
series.setName("No of schools in an year");
series.getData().add(new XYChart.Data<Number,Number>(1970, 15));
series.getData().add(new XYChart.Data<Number,Number>(1980, 30));
series.getData().add(new XYChart.Data<Number,Number>(1990, 60));
series.getData().add(new XYChart.Data<Number,Number>(2000, 120));
series.getData().add(new XYChart.Data<Number,Number>(2013, 240));
series.getData().add(new XYChart.Data<Number,Number>(2014, 300));
//Setting the data to Line chart
linechart.getData().add(series);
//Changing the color of the x and y axis
linechart.getXAxis().setStyle("-fx-border-color: OrangeRed transparent
transparent; -fx-border-width:3");
linechart.getYAxis().setStyle("-fx-border-color: transparent OrangeRed
transparent transparent; -fx-border-width:3");
//Creating a Group object
StackPane root = new StackPane(linechart);
//Setting the scene object
Scene scene = new Scene(root, 595, 300);
stage.setTitle("Line Chart");
stage.setScene(scene);
stage.show();
}
public static void main(String args[]){
launch(args);
}
}
Output

931 Views
