
Article Categories
- All Categories
-
 Data Structure
-
 Networking
-
 RDBMS
RDBMS
-
 Operating System
-
 Java
Java
-
 MS Excel
-
 iOS
iOS
-
 HTML
HTML
-
 CSS
CSS
-
 Android
-
 Python
-
 C Programming
-
 C++
C++
-
 C#
C#
-
 MongoDB
-
 MySQL
MySQL
-
 Javascript
-
 PHP
PHP
-
 Economics & Finance
How to set a background image to a JavaFX chart?
The javafx.scene.chart package provides classes to create various charts namely − line chart, area chart, bar chart, pie chart, bubble chart, scatter chart, etc.
You can create the required chart by instantiating the respective class.
Setting background image and the color
The -fx-background-image class of JavaFX CSS is used to set an image as a background to a chart.
The -fx-background-color (of the region chart-plot-background) class of JavaFX CSS is used to set the back ground color.
JavaFX Scene class has an observable list to hold all the required style sheets. You can get this list using the getStylesheets() method.
To set an image as a background to a chart −
Create a CSS file in the current package of the project sheet (say LineChart.css).
Set the background image using the -fx-background-image CSS class as −
.chart-plot-background {
   -fx-background-image: url("cat.jpg");
}
Set the plot color as transparent using the -fx-background-color CSS class as −
.chart-plot-background {
   -fx-background-color: transparent;
}
In the program, get the observable list of style sheets using the getStylesheets() method.
Add the created CSS file to the list using the add() method.
Example
LineChart.CSS −
.chart {
   -fx-padding: 10px;
   -fx-background-image: url("cat.jpg");
}
.chart-plot-background {
   -fx-background-color: transparent;
}
.chart-vertical-grid-lines {
   -fx-stroke: #dedddc; -fx-stroke-width: 2;
}
.chart-horizontal-grid-lines {
   -fx-stroke: #dedddc; -fx-stroke-width: 2;
}
Example.java −
import javafx.application.Application;
import javafx.scene.Scene;
import javafx.scene.chart.BubbleChart;
import javafx.stage.Stage;
import javafx.scene.chart.NumberAxis;
import javafx.scene.chart.XYChart;
import javafx.scene.layout.StackPane;
public class Example extends Application {
   public void start(Stage stage) {
      //Defining the axes
      NumberAxis xAxis = new NumberAxis(0, 100, 10);
      xAxis.setLabel("Age");
      NumberAxis yAxis = new NumberAxis(20, 100, 10);
      yAxis.setLabel("Weight");
      //Creating the Bubble chart
      BubbleChart bubbleChart = new BubbleChart(xAxis, yAxis);
      //Prepare XYChart.Series objects by setting data
      XYChart.Series series = new XYChart.Series();
      series.setName("work");
      series.getData().add(new XYChart.Data(10,30,4));
      series.getData().add(new XYChart.Data(25,40,5));
      series.getData().add(new XYChart.Data(40,50,9));
      series.getData().add(new XYChart.Data(55,60,7));
      series.getData().add(new XYChart.Data(70,70,9));
      series.getData().add(new XYChart.Data(85,80,6));
      //Setting the data to bar chart
      bubbleChart.getData().add(series);
      //Creating a Group object
      StackPane root = new StackPane(bubbleChart);
      //Setting a scene
      Scene scene = new Scene(root, 595, 300);
      stage.setTitle("Bubble Chart");
      scene.getStylesheets().add("styles/LineChart.css");
      stage.setScene(scene);
      stage.show();
   }
   public static void main(String args[]){
      launch(args);
   }
}
Output
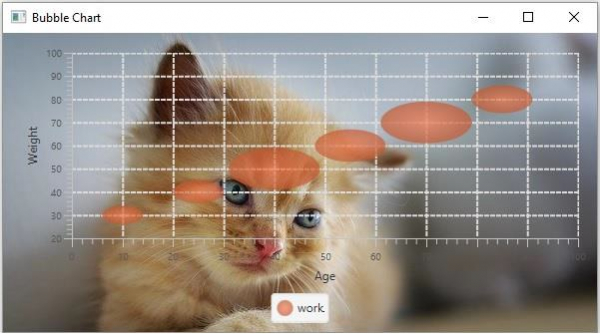

4K+ Views
