
Article Categories
- All Categories
-
 Data Structure
-
 Networking
-
 RDBMS
RDBMS
-
 Operating System
-
 Java
Java
-
 MS Excel
-
 iOS
iOS
-
 HTML
HTML
-
 CSS
CSS
-
 Android
-
 Python
-
 C Programming
-
 C++
C++
-
 C#
C#
-
 MongoDB
-
 MySQL
MySQL
-
 Javascript
-
 PHP
PHP
-
 Economics & Finance
Selected Reading
What are symbols in a JavaFX line chart. How to disable them?
Inline chart the data values have represented a series of points connected by a line. In JavaFX, you can create a line chart by instantiating the javafx.scene.chart.LineChart class.
By default,
A JavaFX Line chart contains symbols pointing out the values in the series along the x-axis. Typically, these are small circles.
The X-Axis on the bottom in the plot.
Y-Axis on the left.
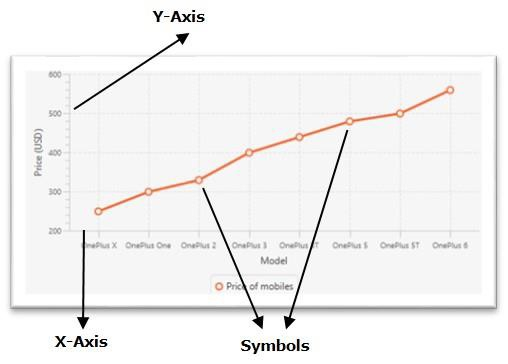
Disabling the symbols
The LineChart class has a property named createSymbols (boolean), which specifies whether to create symbols for data items in the chart. You can set values to this method using the setCreateSymbols() method.
To remove symbols from a line chart you need to invoke this method by passing the boolean value false as an argument to this method.
Example
import javafx.application.Application;
import javafx.geometry.Insets;
import javafx.scene.Scene;
import javafx.stage.Stage;
import javafx.scene.chart.CategoryAxis;
import javafx.scene.chart.LineChart;
import javafx.scene.chart.NumberAxis;
import javafx.scene.chart.XYChart;
import javafx.scene.layout.StackPane;
public class LineChart_Symbols extends Application {
public void start(Stage stage) {
//Defining the x an y axes
CategoryAxis xAxis = new CategoryAxis();
NumberAxis yAxis = new NumberAxis(200, 600, 100);
//Setting labels for the axes
xAxis.setLabel("Model");
yAxis.setLabel("Price (USD)");
//Creating a line chart
LineChart linechart = new LineChart(xAxis, yAxis);
//Preparing the data points for the line
XYChart.Series series = new XYChart.Series();
series.getData().add(new XYChart.Data("OnePlus X", 249));
series.getData().add(new XYChart.Data("OnePlus One", 299));
series.getData().add(new XYChart.Data("OnePlus 2", 329));
series.getData().add(new XYChart.Data("OnePlus 3", 399));
series.getData().add(new XYChart.Data("OnePlus 3T", 439));
series.getData().add(new XYChart.Data("OnePlus 5", 479));
series.getData().add(new XYChart.Data("OnePlus 5T", 499));
series.getData().add(new XYChart.Data("OnePlus 6", 559));
//Setting the name to the line (series)
series.setName("Price of mobiles");
//Setting the data to Line chart
linechart.getData().add(series);
//Removing the symbols of the line chart
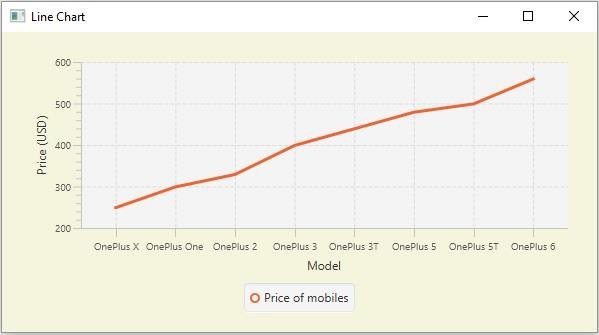
linechart.setCreateSymbols(false);
//Creating a stack pane to hold the chart
StackPane pane = new StackPane(linechart);
pane.setPadding(new Insets(15, 15, 15, 15));
pane.setStyle("-fx-background-color: BEIGE");
//Setting the Scene
Scene scene = new Scene(pane, 595, 300);
stage.setTitle("Line Chart");
stage.setScene(scene);
stage.show();
}
public static void main(String args[]){
launch(args);
}
}
Output

Updated on: 2020-05-20T08:13:17+05:30
1K+ Views

Advertisements