- Excel Charts - Home
- Excel Charts - Introduction
- Excel Charts - Creating Charts
- Excel Charts - Types
- Excel Charts - Column Chart
- Excel Charts - Line Chart
- Excel Charts - Pie Chart
- Excel Charts - Doughnut Chart
- Excel Charts - Bar Chart
- Excel Charts - Area Chart
- Excel Charts - Scatter (X Y) Chart
- Excel Charts - Bubble Chart
- Excel Charts - Stock Chart
- Excel Charts - Surface Chart
- Excel Charts - Radar Chart
- Excel Charts - Combo Chart
- Excel Charts - Chart Elements
- Excel Charts - Chart Styles
- Excel Charts - Chart Filters
- Excel Charts - Fine Tuning
- Excel Charts - Design Tools
- Excel Charts - Quick Formatting
- Excel Charts - Aesthetic Data Labels
- Excel Charts - Format Tools
- Excel Charts - Sparklines
- Excel Charts - PivotCharts
Excel Charts - Sparklines
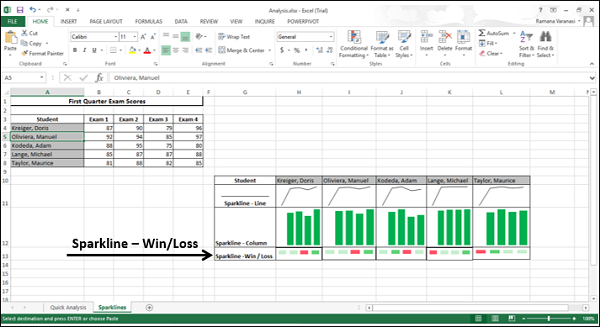
Sparklines are tiny charts placed in single cells, each representing a row of data in your selection. They provide a quick way to see trends.
Sparklines have the following types −
- Line Sparkline
- Column Sparkline
- Win/Loss Sparkline
In this chapter, you will understand the different types of Sparklines and the way to add them to your data. You can add Sparklines through the Quick Analysis tool or through the INSERT tab on the Ribbon.
Sparklines with Quick Analysis
With Quick Analysis Tool, you can show the Sparklines alongside your data in the Excel data table.
Follow the steps given below.
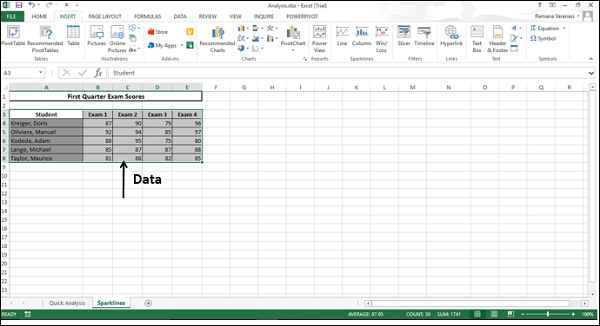
Step 1 − Select the data for which you want to add Sparklines. Keep an empty column to the right side of the data for the Sparklines.
The Quick Analysis icon  appears at the bottom right of your selected data.
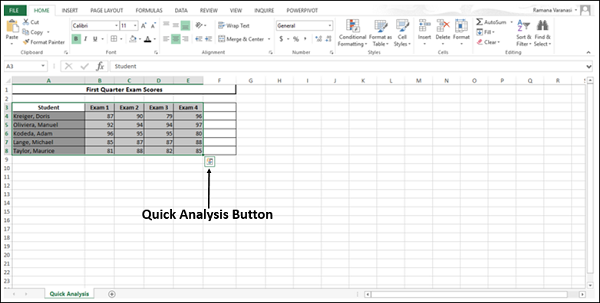
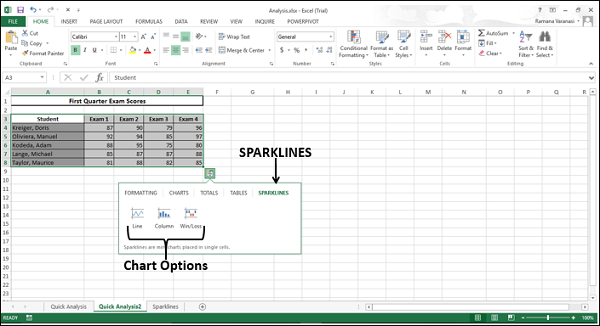
Step 2 − Click the Quick Analysis button that appears (or press CRTL+Q). The Quick Analysis Toolbar appears with the following options
- FORMATTING
- CHARTS
- TOTALS
- TABLES
- SPARKLINES
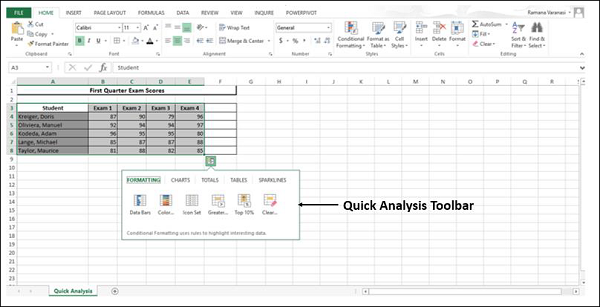
Step 3 − Click SPARKLINES. The chart options displayed are based on the data and may vary.
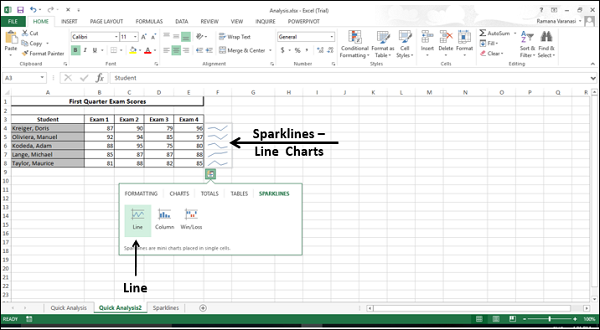
Line Sparkline with Quick Analysis Toolbar
Step 4 − Click the Line button. A line chart for each row is displayed.
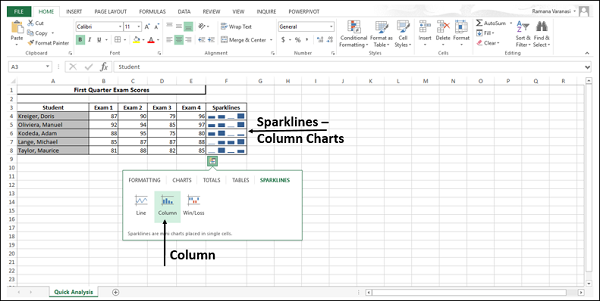
Column Sparkline with Quick Analysis Toolbar
Step 5 − Click the Column button. A column chart for each row is displayed.
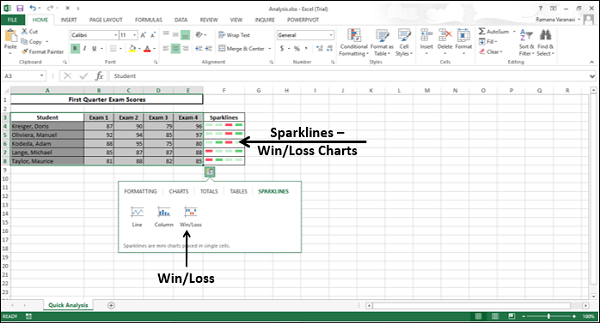
Win/Loss Sparkline with Quick Analysis Toolbar
Step 6 − Click the Win/Loss button. A win/loss chart for each row is displayed.
Sparklines with INSERT tab
When you add Sparklines with INSERT tab on the Ribbon, you can show the Sparklines either alongside your data in the Excel data table as you had seen with Quick Analysis tool or in any location that you can choose on the worksheet.
Follow the steps given to add Sparklines through the Insert tab.
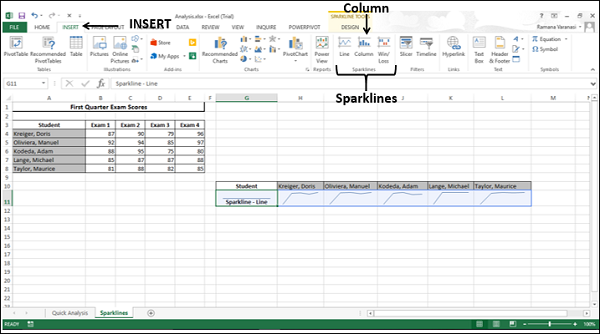
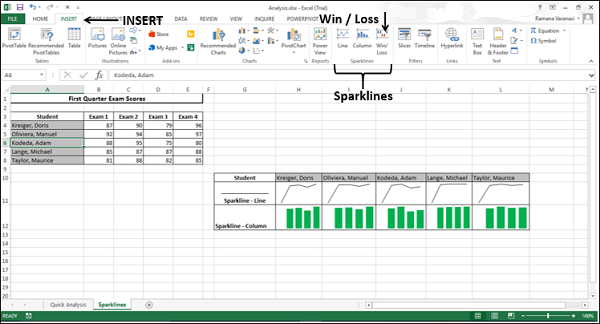
Step 1 − Click the INSERT tab on the Ribbon. The Sparklines group appears on the Ribbon, with three tabs −
- Line
- Column
- Win/Loss
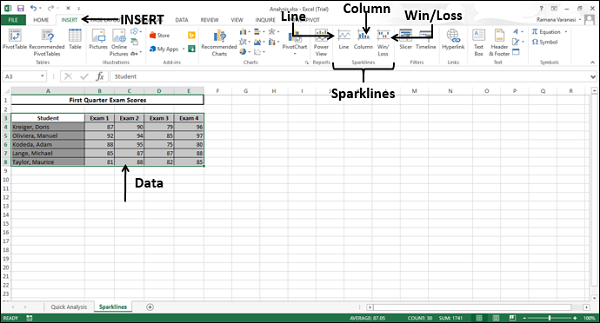
Line Sparkline through INSERT tab on Ribbon
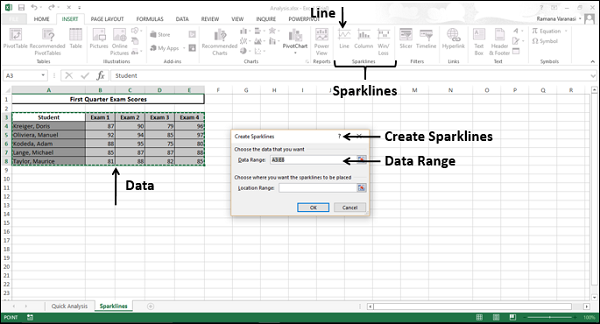
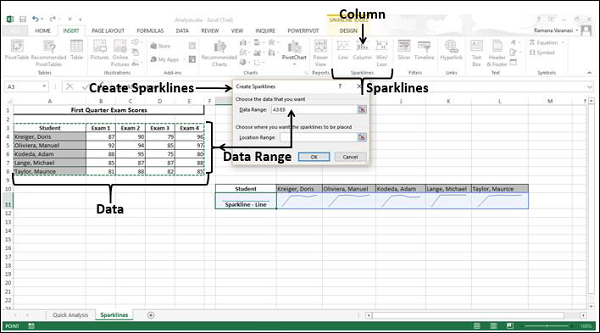
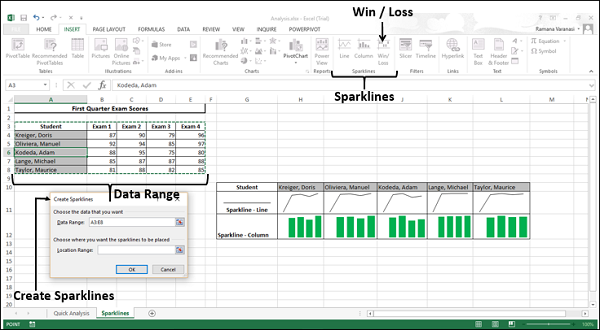
Step 2 − Click the Line option. A Create Sparklines window appears. It will have placeholders for the data range and the location range.
Step 3 − Select Data Range or type the data range in the box.
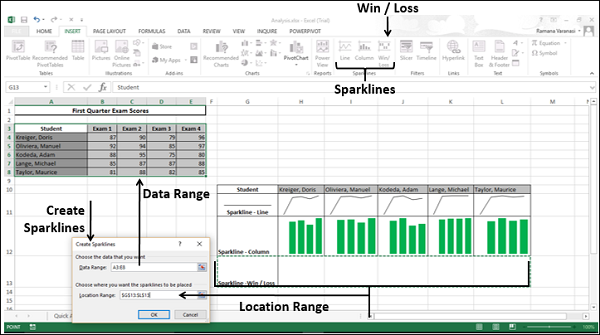
Step 4 − Select the Location range where you want the Sparklines to be placed.
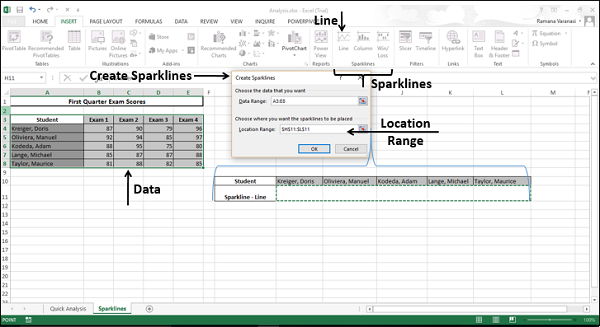
Step 5 − Click OK.
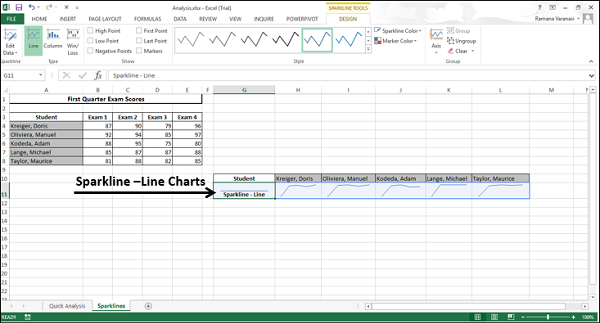
A line chart for each row of the selected data is displayed at the selected location.
Column Sparkline with INSERT tab on Ribbon
Step 1 − Click the INSERT tab on the Ribbon.
Step 2 − Click the Column button in the Sparklines group on the Ribbon.
A Create Sparklines window appears, with placeholders for data range and location range.
Step 3 − Select the data range.
Step 4 − Select the location range where you want the Sparklines to be placed.
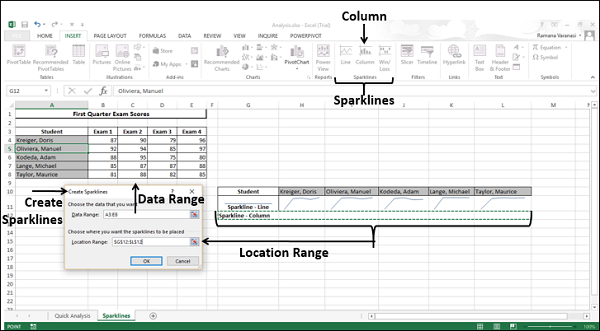
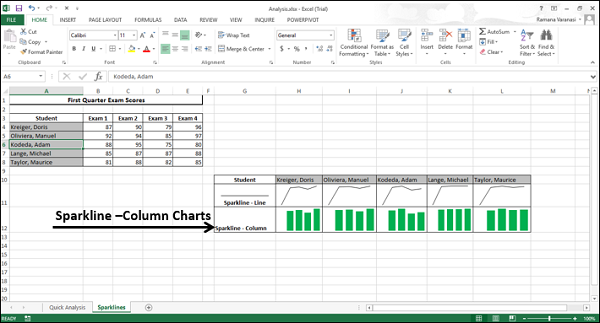
Step 5 − Click OK.
A column chart for each row of the selected data is displayed at the selected location.
Win/Loss Sparkline with INSERT tab on Ribbon
Step 1 − Click the INSERT tab on the Ribbon.
Step 2 − Click the Win/Loss button in the Sparklines group on the Ribbon.
A Create Sparklines window appears, with placeholders for data range and location range.
Step 3 − Select the data range.
Step 4 − Select the Location Range where you want the Sparklines to be placed.
Step 5 − Click OK.
A Win/Loss chart for each row of the selected data is displayed at the selected location.