
Article Categories
- All Categories
-
 Data Structure
-
 Networking
-
 RDBMS
RDBMS
-
 Operating System
-
 Java
Java
-
 MS Excel
-
 iOS
iOS
-
 HTML
HTML
-
 CSS
CSS
-
 Android
-
 Python
-
 C Programming
-
 C++
C++
-
 C#
C#
-
 MongoDB
-
 MySQL
MySQL
-
 Javascript
-
 PHP
PHP
-
 Economics & Finance
Selected Reading
How to include a factor level in bar blot using ggplot2 in R if that level has a frequency zero.
In research, sometimes we get a count of zero for a particular level of a factor variable but we might want to plot that in the bar plot so that anyone who look at the plot can easily understand what is missing and compare all the factor levels. In ggplot2, it can be done with the help of scale_x_discrete function.
> x<-factor(rep(c("S1","S2","S3","S4"),times=5))
> df<-data.frame(x)
Suppose you have a factor level S5 as well but the frequency for S5 is zero as shown below −
> df$x<-factor(df$x,levels=c("S1","S2","S3","S4","S5"))
> df$x
    [1] S1 S2 S3 S4 S1 S2 S3 S4 S1 S2 S3 S4 S1 S2 S3 S4 S1 S2 S3 S4
Levels: S1 S2 S3 S4 S5
Loading ggplot2 package −
> library(ggplot2)
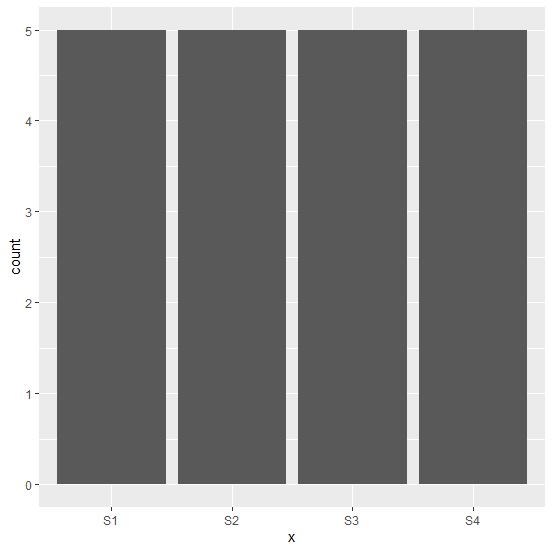
Now when we plot the bar plot the fifth level is not there −
> ggplot(df,aes(x))+geom_bar()
Output
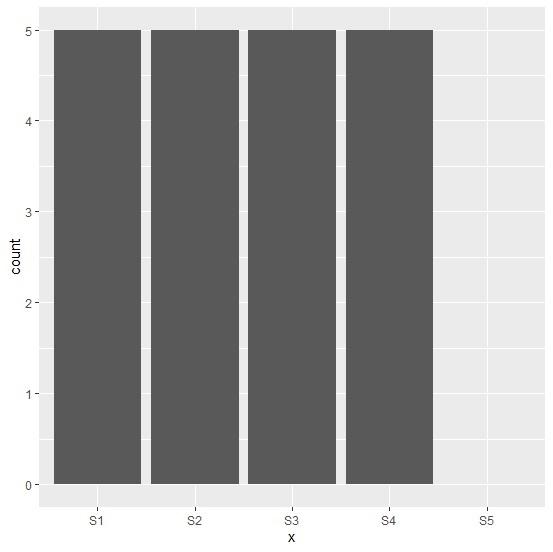
The R command to plot all the factor levels is as shown below −
> ggplot(df,aes(x))+geom_bar()+
+ scale_x_discrete(drop=FALSE)
Output

Updated on: 2020-08-10T13:57:01+05:30
525 Views

Advertisements