
Article Categories
- All Categories
-
 Data Structure
-
 Networking
-
 RDBMS
RDBMS
-
 Operating System
-
 Java
Java
-
 MS Excel
-
 iOS
iOS
-
 HTML
HTML
-
 CSS
CSS
-
 Android
-
 Python
-
 C Programming
-
 C++
C++
-
 C#
C#
-
 MongoDB
-
 MySQL
MySQL
-
 Javascript
-
 PHP
PHP
-
 Economics & Finance
Selected Reading
How to display average line for y variable using ggplot2 in R?
To display the average line for y variable using ggplot2, we can use geom_hline function along with the yintercept. In the yintercept, we would need to calculate the mean of the y variable and we can also change the colour of the line using color argument inside the geom_hline function.
Example
Consider the below data frame −
> x<-rnorm(20)
> y<-rnorm(20)
> df<-data.frame(x,y)
> df
Output
x y
1 -1.07323904 0.368641641
2 0.92531148 -0.196530651
3 -0.57433739 0.710957804
4 1.17367100 0.300110517
5 0.00769624 -1.287517035
6 0.64901161 -0.476105351
7 0.70197701 -0.683592585
8 -0.80807441 -1.716264317
9 0.10827026 0.116964308
10 -1.10451308 0.660382307
11 -0.01612692 -1.182533283
12 2.20292198 -1.890223763
13 -1.03368161 -0.526983486
14 0.24688341 -0.709657125
15 0.46439214 -0.611872054
16 -0.86472988 0.100839958
17 -1.29702868 -0.178357498
18 -1.51781901 0.006079342
19 0.03744727 -1.062274129
20 -1.62755835 -1.532681680
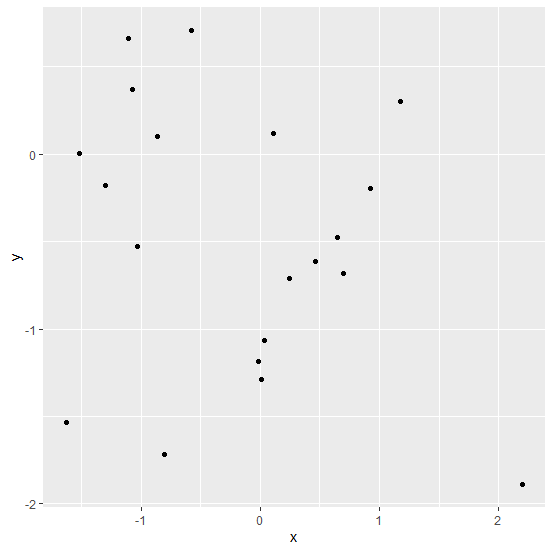
Loading ggplot2 package and creating a point chart between x and y −
> library(ggplot2)
> ggplot(df,aes(x,y))+geom_point()
Output
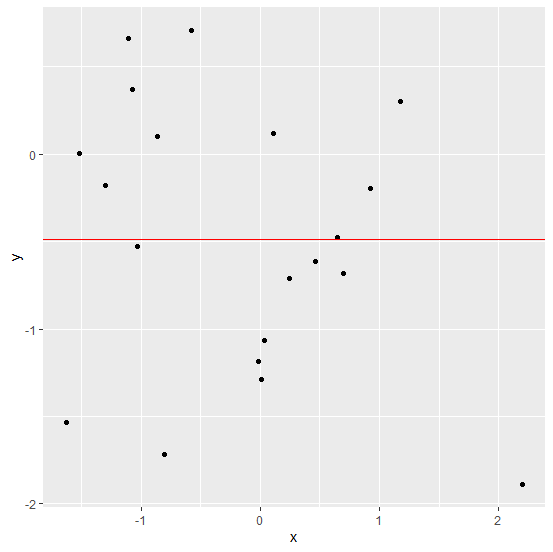
Creating the point chart between x and y with average line for y −
> ggplot(df,aes(x,y))+geom_point()+geom_hline(yintercept=mean(y),color="red")
Output

Updated on: 2026-03-11T22:50:56+05:30
2K+ Views

Advertisements