
Article Categories
- All Categories
-
 Data Structure
-
 Networking
-
 RDBMS
RDBMS
-
 Operating System
-
 Java
Java
-
 MS Excel
-
 iOS
iOS
-
 HTML
HTML
-
 CSS
CSS
-
 Android
-
 Python
-
 C Programming
-
 C++
C++
-
 C#
C#
-
 MongoDB
-
 MySQL
MySQL
-
 Javascript
-
 PHP
PHP
-
 Economics & Finance
How to display a variable with subscript ggplot2 graph in R?
Sometimes we have variables that have a subscript associated with them. This subscript is used to define the characteristics of the variable or to differentiate similar variables from each other.
In this type of situation, displaying a variable with subscript in a graph created with the help of ggplot2 can be done by using the geom_text function. Check out the below Example to understand how it can be done.
Example
Consider the below data frame −
x1<-rnorm(20)
x2<-rnorm(20)
y1<-rnorm(20)
df<-data.frame(x1,x2,y1)
df
The following dataframe is created
            x1          x2         y1
 1 -0.31525919  2.67454325 -0.57732755
 2  1.99006420  0.78801339  0.50358685
 3  0.89976037  1.72569787 -0.99164173
 4 -0.83917900  1.08725917 -1.16835169
 5 -1.42694308  1.13963766 -0.27289094
 6 -0.86478551  0.96600534 -1.05109773
 7 -0.85993732 -1.76012492 -0.93524050
 8 -1.29924306  1.18749553  0.03820085
 9  0.26418756  0.47682055  0.48917207
10  2.00518885 -1.26428211 -0.92215552
11  1.09006592 -0.74973755  0.93209043
12  1.05100909  0.49159307 -0.77247422
13 -0.62451882  0.53191819  1.25542082
14 -1.19159113 -1.44492176  0.24861869
15  0.37581539 -0.81251569 -0.26883516
16 -0.09544343  0.67109002  0.22284421
17 -0.81413602 -0.48702643 -1.51936451
18 -0.16966281  0.03563694  1.88394447
19  0.34778835 -1.45162938 -2.28972427
20  1.70094258 -0.59359544 -1.50645407
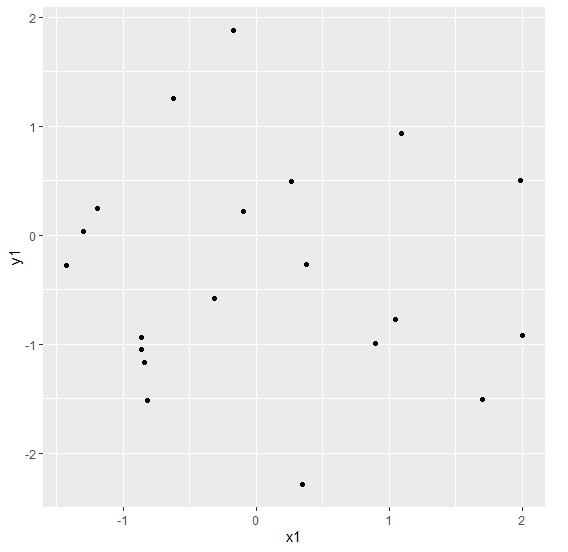
To load the ggplot2 package and create scatterplot between x1 and y1 on the above created data frame, add the following code to the above snippet −
x1<-rnorm(20)
x2<-rnorm(20)
y1<-rnorm(20)
df<-data.frame(x1,x2,y1)
library(ggplot2)
ggplot(df,aes(x1,y1))+geom_point()
Output
If you execute all the above given snippets as a single program, it generates the following Output −
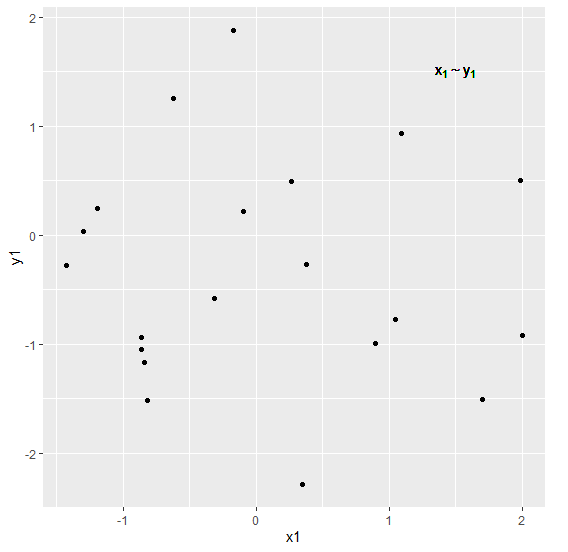
To create scatterplot between x1 and y1 where 1 is subscript on the above created data frame, add the following code to the above snippet −
x1<-rnorm(20)
x2<-rnorm(20)
y1<-rnorm(20)
df<-data.frame(x1,x2,y1)
library(ggplot2)
ggplot(df,aes(x1,y1))+geom_point()+geom_text(aes(label="x[1] %~%
y[1]",x=1.5,y=1.5),parse=TRUE)
Output
If you execute all the above given snippets as a single program, it generates the following Output −

1K+ Views
