
Article Categories
- All Categories
-
 Data Structure
-
 Networking
-
 RDBMS
RDBMS
-
 Operating System
-
 Java
Java
-
 MS Excel
-
 iOS
iOS
-
 HTML
HTML
-
 CSS
CSS
-
 Android
-
 Python
-
 C Programming
-
 C++
C++
-
 C#
C#
-
 MongoDB
-
 MySQL
MySQL
-
 Javascript
-
 PHP
PHP
-
 Economics & Finance
Selected Reading
How to deal with warning message `stat_bin()` using `bins = 30`. Pick better value with `binwidth`. in R while creating a histogram?
The default value for bins is 30 but if we don’t pass that in geom_histogram then the warning message is shown by R in most of the cases. To avoid that, we can simply put bins=30 inside the geom_histogram() function. This will stop showing the warning message.
Consider the below data frame −
x<-rnorm(50000,5,1)
df<-data.frame(x)
Loading ggplot2 package and creating histogram of x −
Example
library(ggplot2) ggplot(df,aes(x))+geom_histogram() `stat_bin()` using `bins = 30`. Pick better value with `binwidth`.
Output

Creating the histogram by specifying the bins −
Example
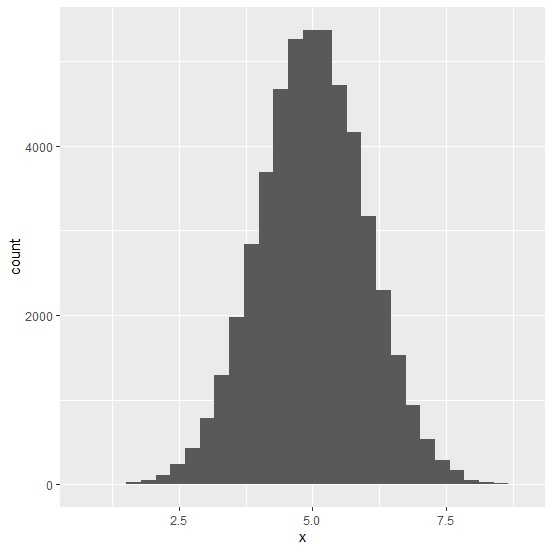
ggplot(df,aes(x))+geom_histogram(bins=30)
Output

Updated on: 2020-10-18T14:16:46+05:30
8K+ Views

Advertisements