 Data Structure
 Networking
 RDBMS
RDBMS Operating System
 Java
Java MS Excel
 iOS
iOS HTML
HTML CSS
CSS Android
 Python
 C Programming
 C++
C++ C#
C# MongoDB
 MySQL
MySQL Javascript
 PHP
PHP
- Selected Reading
- UPSC IAS Exams Notes
- Developer's Best Practices
- Questions and Answers
- Effective Resume Writing
- HR Interview Questions
- Computer Glossary
- Who is Who
How to make two plots side-by-side using Python?
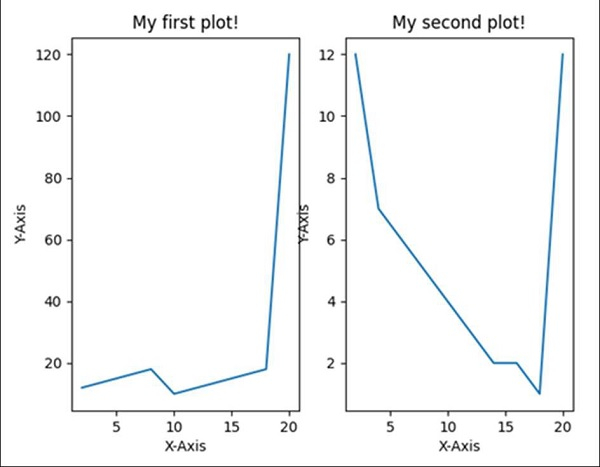
Using subplot(row, col, index) method, we can split a figure in row*col parts, and can plot the figure at the index position. In the following program, we will create two diagrams in a single figure.
Steps
Creating x, y1, y2 points using numpy.
With nrows = 1, ncols = 2, index = 1, add subplot to the current figure, using the subplot() method.
Plot the line using x and y1 points, using the plot() method.
Set up the title, label for X and Y axes for Figure 1, using plt.title(), plt.xlabel(), and plt.ylabel() methods.
With nrows = 1, ncols = 2, index = 2, add subplot to the current figure, using the subplot() method.
Plot the line using x and y2 points, using the plot() method.
Set up the title, label for X and Y axes for Figure 2, using plt.title(), plt.xlabel(), and plt.ylabel() methods.
To show the figure, use the plt.show() method.
Example
from matplotlib import pyplot as plt
import numpy as np

xPoints = np.array([2, 4, 6, 8, 10, 12, 14, 16, 18, 20])
y1Points = np.array([12, 14, 16, 18, 10, 12, 14, 16, 18, 120])
y2Points = np.array([12, 7, 6, 5, 4, 3, 2, 2, 1, 12])

plt.subplot(1, 2, 1) # row 1, col 2 index 1
plt.plot(xPoints, y1Points)
plt.title("My first plot!")
plt.xlabel('X-axis ')
plt.ylabel('Y-axis ')

plt.subplot(1, 2, 2) # index 2
plt.plot(xPoints, y2Points)
plt.title("My second plot!")
plt.xlabel('X-axis ')
plt.ylabel('Y-axis ')

plt.show()
Output

Learn More: Matplotlib Tutorial, Python Tutorial

