
Article Categories
- All Categories
-
 Data Structure
-
 Networking
-
 RDBMS
RDBMS
-
 Operating System
-
 Java
Java
-
 MS Excel
-
 iOS
iOS
-
 HTML
HTML
-
 CSS
CSS
-
 Android
-
 Python
-
 C Programming
-
 C++
C++
-
 C#
C#
-
 MongoDB
-
 MySQL
MySQL
-
 Javascript
-
 PHP
PHP
-
 Economics & Finance
Selected Reading
How to create the boxplots in base R ordered by means?
To create the boxplots in base R ordered by means, we first need to order the categorical column based on the mean of the numerical column and then the boxplot will be created.
For example, if we have a data frame df that has a categorical column x and a numerical column y then the boxplot ordered by means can be created by using df$x<- with(df,reorder(x,y,mean)) and boxplot(y~x,data=df).
Example
Consider the below data frame −
x<-sample(LETTERS[1:4],25,replace=TRUE)
y<-rpois(25,10)
df<-data.frame(x,y)
df
Output
   x y
1  B 7
2  A 7
3  C 8
4  B 8
5  C 9
6  C 9
7  A 10
8  D 10
9  B 11
10 A 9
11 C 10
12 B 10
13 B 13
14 D 10
15 B 10
16 A 9
17 B 12
18 B 8
19 B 12
20 D 8
21 C 9
22 A 11
23 D 8
24 B 17
25 B 13
Ordering the x by mean of y −
Example
df$x<-with(df,reorder(x,y,mean))
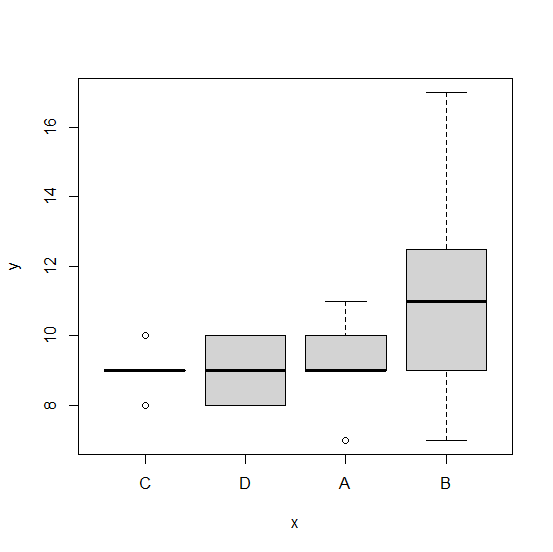
Creating the boxplots −
Example
boxplot(y~x,data=df)
Output

Updated on: 2026-03-11T22:50:54+05:30
202 Views

Advertisements