
Article Categories
- All Categories
-
 Data Structure
-
 Networking
-
 RDBMS
RDBMS
-
 Operating System
-
 Java
Java
-
 MS Excel
-
 iOS
iOS
-
 HTML
HTML
-
 CSS
CSS
-
 Android
-
 Python
-
 C Programming
-
 C++
C++
-
 C#
C#
-
 MongoDB
-
 MySQL
MySQL
-
 Javascript
-
 PHP
PHP
-
 Economics & Finance
Selected Reading
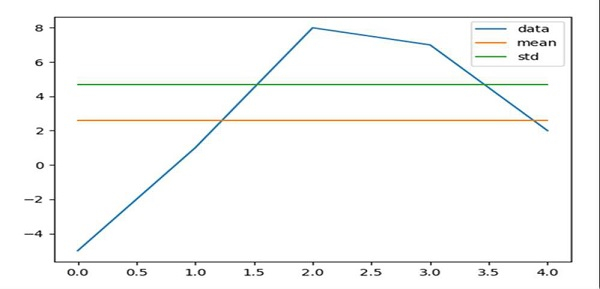
Plot mean and standard deviation in Matplotlib
First, we can calculate the mean and standard deviation of the input data using Pandas dataframe.
Then, we could plot the data using Matplotlib.
Steps
Create a list and store it in data.
Using Pandas, create a data frame with data (step 1), mean, std.
Plot using a dataframe.
To show the figure, use plt.show() method.
Example
import pandas as pd
from matplotlib import pyplot as plt

data = [-5, 1, 8, 7, 2]

df = pd.DataFrame({
      'data': data,
      'mean': [2.6 for i in range(len(data))],
      'std': [4.673328578 for i in range(len(data))]})

df.plot()
plt.show()
Output

Updated on: 2021-03-17T08:49:54+05:30
11K+ Views

Advertisements