
Article Categories
- All Categories
-
 Data Structure
-
 Networking
-
 RDBMS
RDBMS
-
 Operating System
-
 Java
Java
-
 MS Excel
-
 iOS
iOS
-
 HTML
HTML
-
 CSS
CSS
-
 Android
-
 Python
-
 C Programming
-
 C++
C++
-
 C#
C#
-
 MongoDB
-
 MySQL
MySQL
-
 Javascript
-
 PHP
PHP
-
 Economics & Finance
Selected Reading
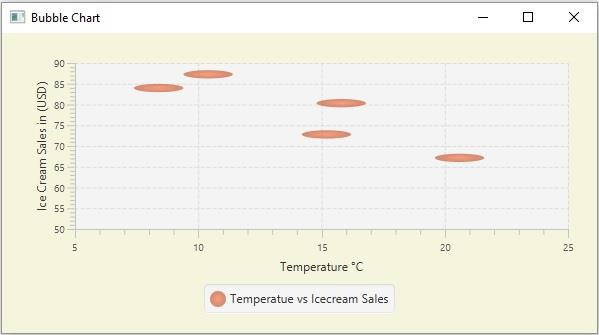
How to create a bubble chart with two parameters in JavaFX?
The bubble chart accepts a series of data points (x, y) as input values and, creates bubbles for the data points in the given series. In JavaFX, you can create a bubble chart by instantiating the javafx.scene.chart.BubbleChart class.
Generally, in all X-Y charts, the data points plot two values (x, y). In the bubble chart, there is a third value which is represented by the radius of the bubble. This chart comes handy while plotting the data points in 3 dimensions.
Anyhow, it is not mandatory to have the third value, it is only optional. Like any other XY chart, you can create a bubble chart with two values.
Example
Following is a JavaFX example demonstrating, the creation of a bubble chart with two values −
import javafx.application.Application;
import javafx.geometry.Insets;
import javafx.scene.Scene;
import javafx.stage.Stage;
import javafx.scene.chart.BubbleChart;
import javafx.scene.chart.NumberAxis;
import javafx.scene.chart.XYChart;
import javafx.scene.layout.StackPane;
public class BubbleChart_TwoParams extends Application {
   public void start(Stage stage) {
      //Creating the X and Y axes
      NumberAxis xAxis = new NumberAxis(5, 25, 5);
      NumberAxis yAxis = new NumberAxis(50, 90, 5);
      //Setting labels to the axes
      xAxis.setLabel("Temperature °C");
      yAxis.setLabel("Ice Cream Sales in (USD)");
      //Creating the Scatter chart
      BubbleChart bubbleChart = new BubbleChart(xAxis, yAxis);
      //Preparing data for the scatter chart
      XYChart.Series series = new XYChart.Series();
      series.getData().add(new XYChart.Data(15.2, 72.79));
      series.getData().add(new XYChart.Data(8.39, 83.97));
      series.getData().add(new XYChart.Data(20.6, 67.14));
      series.getData().add(new XYChart.Data(15.8, 80.32));
      series.getData().add(new XYChart.Data(10.4, 87.27));
      //Setting the data to scatter chart
      bubbleChart.getData().add(series);
      //Setting title to the scatter chart
      //scatterChart.setTitle("Ice Cream Sales vs Temperature");
      //Setting name to the series
      series.setName("Temperatue vs Icecream Sales");
      //Creating a stack pane to hold the chart
      StackPane pane = new StackPane(bubbleChart);
      pane.setPadding(new Insets(15, 15, 15, 15));
      pane.setStyle("-fx-background-color: BEIGE");
      //Setting the Scene
      Scene scene = new Scene(pane, 595, 300);
      stage.setTitle("Bubble Chart");
      stage.setScene(scene);
      stage.show();
   }
   public static void main(String args[]){
      launch(args);
   }
}
Output

Updated on: 2020-05-20T08:18:19+05:30
204 Views

Advertisements