
Article Categories
- All Categories
-
 Data Structure
-
 Networking
-
 RDBMS
RDBMS
-
 Operating System
-
 Java
Java
-
 MS Excel
-
 iOS
iOS
-
 HTML
HTML
-
 CSS
CSS
-
 Android
-
 Python
-
 C Programming
-
 C++
C++
-
 C#
C#
-
 MongoDB
-
 MySQL
MySQL
-
 Javascript
-
 PHP
PHP
-
 Economics & Finance
Selected Reading
How to change the position of axes titles to top for X-variable and to right for Y-variable in R?
The default position of axes titles in any software or programming language for any 2D graph is bottom for X-axis and left for Y-axis but we might to change the position of these titles to top and right respectively. This can be done by using scale_x_continuous(position="top") and scale_y_continuous(position="right") functions of ggplot2 package.
Example
Consider the below data frame −
set.seed(101)
x<-rnorm(10,1)
y<-rnorm(10,2)
df<-data.frame(x,y)
df
Output
      x         y
1 0.6739635 2.52644810
2 1.5524619 1.20515556
3 0.3250562 3.42775554
4 1.2143595 0.53318031
5 1.3107692 1.76331662
6 2.1739663 1.80666204
7 1.6187899 1.15024526
8 0.8872657 2.05846550
9 1.9170283 1.18232964
10 0.7767406 -0.05030782
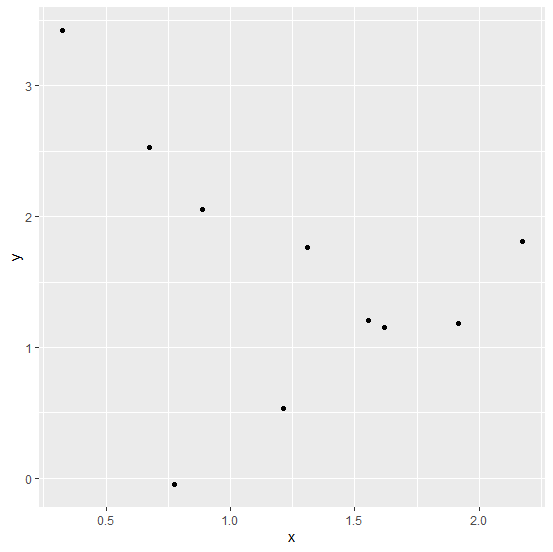
Loading ggplot2 package and creating a scatterplot between x and y −
Examplelibrary(ggplot2)
ggplot(df,aes(x,y))+geom_point()
Output

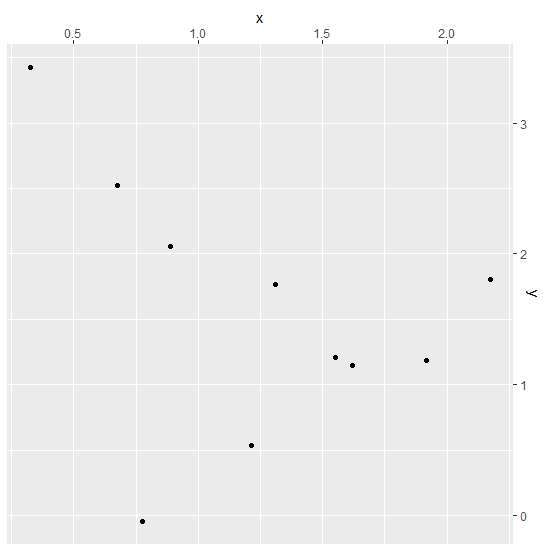
Creating the scatterplot with y on right hand side and x on top of the graph −
Example
ggplot(df,aes(x,y))+geom_point()+scale_x_continuous(position="top")+scale_y_continu
ous(position="right")
Output

Updated on: 2026-03-11T22:50:51+05:30
370 Views

Advertisements