 Data Structure
 Networking
 RDBMS
RDBMS Operating System
 Java
Java MS Excel
 iOS
iOS HTML
HTML CSS
CSS Android
 Python
 C Programming
 C++
C++ C#
C# MongoDB
 MySQL
MySQL Javascript
 PHP
PHP
- Selected Reading
- UPSC IAS Exams Notes
- Developer's Best Practices
- Questions and Answers
- Effective Resume Writing
- HR Interview Questions
- Computer Glossary
- Who is Who
Gaussian fit using Python
Data analysis and visualization are crucial nowadays, where data is the new oil. Typically data analysis involves feeding the data into mathematical models and extracting useful information. The Gaussian fit is a powerful mathematical model that data scientists use to model the data based on a bell-shaped curve. In this article, we will understand Gaussian fit and how to code it using Python.
What is Gaussian Fit
A bell-shaped curve characterizes the Gaussian distribution. The bell-shaped curve is symmetrical around the mean(?). We define a probability density function as follows
f(x) = (1 / (? * sqrt(2?))) * exp(-(x - ?)² / (2 * ?²))
Here ? represents the standard deviation of the distribution, ? is the mean, ? (pie) is constant, whose value is approximately 3.14.
We must estimate the values of ? and ? to fit any data into the Gaussian distribution. Doing this task manually or creating logical code would be tedious and inconvenient. Python, therefore, provides us with some in-built libraries and functions to deal with it.
Bell Curve
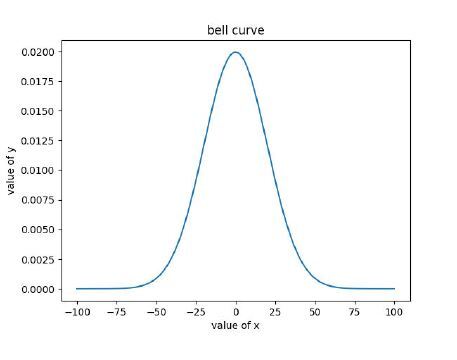
The Bell curve is the plot obtained through the Gaussian distribution. Before moving further, the readers need to know the typical shape of the Bell curve. This would give a better intuition to the readers in the future when they deal with the Gaussian distribution.
Example code
In the below code, we generated a uniform data point using the arrange function of Numpy. We used the norm.pdf function to calculate the probability distribution function of the Gaussian distribution. We passed 25 as the means and standard deviation to be 25. We plotted the probability distribution function with the matplotlib library. An important observation from the graph is that the values around 0 are more common than extreme values like -100 and 100.
import numpy as np
import scipy as sp
from scipy import stats
import matplotlib.pyplot as plt
x_data = np.arange(-100, 100, 0.01)
y_data = stats.norm.pdf(x_data, 25, 20)
plt.plot(x_data, y_data)
plt.title("bell curve")
plt.xlabel("value of x")
plt.ylabel("value of y")
plt.show()
Output

How To Use The curve_fit Method
As discussed in our previous section, the main idea of fitting the Gaussian distribution is to find the optimum value of ? and ?. Hence we can perform the following algorithm to achieve the same.
First, define the Gaussian function. This can be written by our own as follows
def gaussian(x, ?, ?):
return (1 / (? * np.sqrt(2 * np.pi))) * np.exp(-((x - ?) ** 2) / (2 * ?
** 2))
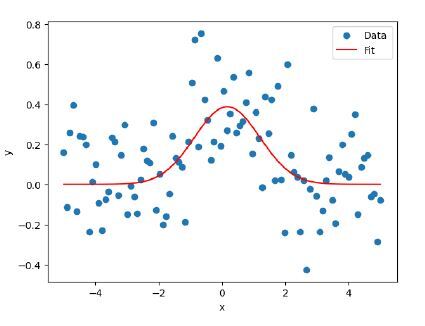
Perform Gaussian fit with the help of the curve_fit method from the SciPy package. The method returns the optimum parameters for the ? and ?.
Next, generate the plot by generating the y values and using any standard data visualization library like Matplotlib
Example
import numpy as np
import matplotlib.pyplot as plt
from scipy.optimize import curve_fit
def gaussian(x, ?, ?):
   return (1 / (? * np.sqrt(2 * np.pi))) * np.exp(-((x - ?) ** 2) / (2 * ?** 2))
x_data = np.linspace(-5, 5, 100)
y_data = gaussian(x_data, 0, 1) + np.random.normal(0, 0.2, 100)
popt, pcov = curve_fit(gaussian, x_data, y_data)
?_fit, ?_fit = popt
y_fit = gaussian(x_data, ?_fit, ?_fit)
plt.scatter(x_data, y_data, label='Data')
plt.plot(x_data, y_fit, 'r', label='Fit')
plt.xlabel('x')
plt.ylabel('y')
plt.legend()
plt.show()
Output

NOTE ? The output generated would differ each time since we generate random numbers
Conclusion
In this article, we understood how to perform Gaussian fit in Python. This is a valuable technique for dealing with bell distribution curves. Luckily python provides us with standard libraries which we can use to fit the data to the Gaussian distribution model. We recommend the readers try the distribution on a few more datasets to have more confidence in the topic.

