
Article Categories
- All Categories
-
 Data Structure
-
 Networking
-
 RDBMS
RDBMS
-
 Operating System
-
 Java
Java
-
 MS Excel
-
 iOS
iOS
-
 HTML
HTML
-
 CSS
CSS
-
 Android
-
 Python
-
 C Programming
-
 C++
C++
-
 C#
C#
-
 MongoDB
-
 MySQL
MySQL
-
 Javascript
-
 PHP
PHP
Gaussian Library Arduino
The Gaussian Library by Ivan Seidel helps you implement Gaussian math, Kalman filters and moving averages in Arduino.
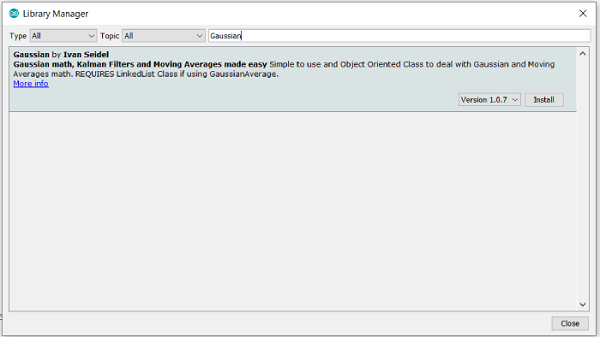
To download this library, go to the Library Manager and search for 'Gaussian'. Install the library by Ivan Seidel.
Once installed, go to: File → Examples → Gaussian, and open the GaussianRandomPlot example.
Example
Now, this example will seem overwhelming at first. Therefore, what I'll suggest is first running this example on your Arduino, and seeing the Serial Monitor output. I'll show it here.
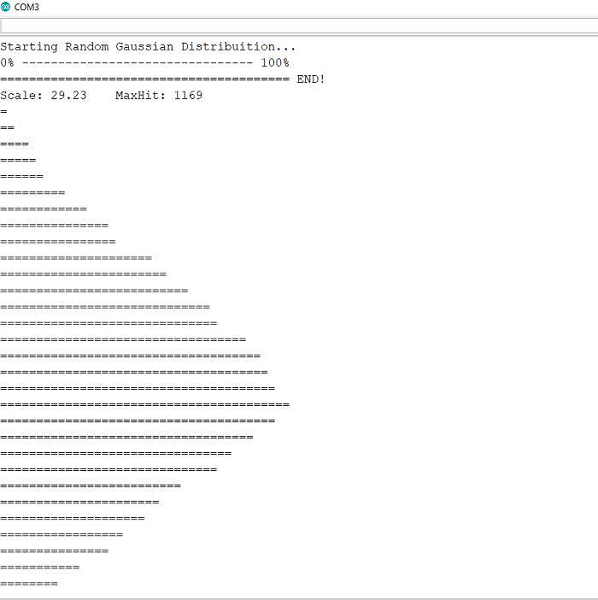
In summary, this code generates 20,000 random Gaussian numbers, i.e., the numbers follow the Gaussian bell-curve distribution, and segregates them in different columns or towers (referred to as hits), based on their distance from the mean. These hits are then plotted, and the plot shows that the distribution is indeed Gaussian.
Code Walkthrough
Let's begin the code walkthrough.
We begin with the inclusion of the library.
#include <Gaussian.h>
Within Setup, we just initialize Serial, and add a seed to the random number generator.
void setup() {
   Serial.begin(9600);
   Serial.println("
\nStarting Random Gaussian Distribuition...");
   delay(20);
   randomSeed(analogRead(0));
}
We then define a couple of constants. SIZE represents the number of bars that we will have.TESTS represents the number of random numbers we will generate. BAR_SIZE represents the maximum size or the height of each bar (number of = characters).
// The number of "slots" to record the hits of gaussian random
#define SIZE 36

// How many tests will be performed
#define TESTS 20000

// How many characters will have, in width?
#define BAR_SIZE 40
Within the loop, we first create a Gaussian object, with mean 0 and variance 10.
Now, this mean will be in reference to the central bar when plotted. Therefore, the 'zero' value is defined (where the Gaussian peaks). Since we have 36 bars, and 0 mean, the peak will be at the 18th bar.
We then generate a hits array of size equal to number of bars, and initialize it with 0. This array will ultimately store how many of the random points lie within each bar.
void loop() {
      Gaussian g1 = Gaussian(0, 10);
      long zero = SIZE/2 - g1.mean;
      long hits[SIZE] = {0};

      // Zero the array
      for(int i = 0; i < SIZE; i++)
         hits[i] = 0;
Later, some Serial Monitor printing is done 0 to 100% line.
      // Print Header (0% ------------- 100%)
      Serial.print("0% ");

      for(int i = 3; i < BAR_SIZE - 5; i++)
         Serial.print("-");

      Serial.println(" 100%");
Next, the a for loop iterating till the number of tests is run. The first part of the for loop is trivial and just prints the ======== line below the 0 ---- 100% line. The important part is the second half. A Gaussian random number is generated, using g1.random(). Depending on its value, its place, i.e. which bar it will lie in is decided (int place = (int)round(val - g1.mean + zero);). The place is then constrained between 0 and 36, i.e., entries less than 0 are pulled up to 0, and those >36 are pushed down to 36. Finally, the value of the hits array for that place is incremented, indicating that the generated random value is finally allocated the bar.
      // Process the gaussians and randomize 'TESTS' times
      int lastStep = 0, step;
      Serial.print("=");
      for(int i = 0; i < TESTS; i++){
         step = (double)i/TESTS*BAR_SIZE;
         if(step > lastStep){
               while(lastStep < step){
                  Serial.print("=");
                  lastStep++;
               }
         }
         double val = g1.random();
         int place = (int)round(val - g1.mean + zero);
         place = constrain(place, 0, SIZE);
         hits[place]++;
   }
   Serial.print(" END!
");
After this, the maxHit is calculated, i.e. the bar containing the maximum number of points. Since the max size of the bar is BAR_SIZE (40), a scaling factor is determined, so that the bar with the maxHit has a size of 40, and all others are scaled accordingly. The value of maxHit and scale are printed.
// Just to scale the plot on the Serial, to improve visualization
long maxHit = 0;
   for(int i = 0; i < SIZE; i++){
   maxHit = max(maxHit, hits[i]);
      // Uncomment this line if you want to see the NUMBER of hits
      // Serial.println(hits[i]);
   }
   // This will print the bar graphic
   double scale = (double)maxHit/BAR_SIZE;
   Serial.print("Scale: ");
   Serial.print(scale);
   Serial.print("\tMaxHit: ");
   Serial.println(maxHit);
The rest of the code is concerned with plotting the values on the Serial Monitor.
for(int i = 1; i < SIZE - 1; i++){
         int len = hits[i]/scale;
         for(int x = 0; x < len; x++)
               Serial.print("=");
         Serial.print("
");
   }
   // Wait until dinosaurs come back on earth
   while(1);
}
So, this code essentially shows that random numbers generated using g1.random() follow a random distribution.
You can go through the ReadMe of the GitHub repo of this library, to know about the other functions available within this library.

1K+ Views
