- FuelPHP - Home
- FuelPHP - Introduction
- FuelPHP - Installation
- FuelPHP - Architecture Overview
- FuelPHP - Simple Web Application
- FuelPHP - Configuration
- FuelPHP - Controllers
- FuelPHP - Routing
- FuelPHP - Requests & Response
- FuelPHP - Views
- FuelPHP - Presenters
- FuelPHP - Models & Database
- FuelPHP - Form Programming
- FuelPHP - Validation
- Advanced Form Programming
- FuelPHP - File Uploading
- FuelPHP - Ajax
- FuelPHP - HMVC Request
- FuelPHP - Themes
- FuelPHP - Modules
- FuelPHP - Packages
- Cookie & Session Management
- FuelPHP - Events
- FuelPHP - Email Management
- FuelPHP - Profiler
- Error Handling & Debugging
- FuelPHP - Unit Testing
- Complete Working Example
- FuelPHP Useful Resources
- FuelPHP - Quick Guide
- FuelPHP - Useful Resources
- FuelPHP - Discussion
FuelPHP - Profiler
Profiler is one of the important tools to analyze and improve the performance of the application. FuelPHP provides an excellent profiler to profile the application. Let us learn about the profile in FuelPHP in this chapter.
Enable Profiling
Profiling is disabled by default. To enable profiling, set the attribute profiling to true in the main configuration file, fuel/app/config/config.php as follows.
'profiling' => true,
Now, profiling is enabled in the application. Once profiling in enabled, all requested pages will show an extra tab at the bottom of the page with profiling information as shown in the following screenshot.
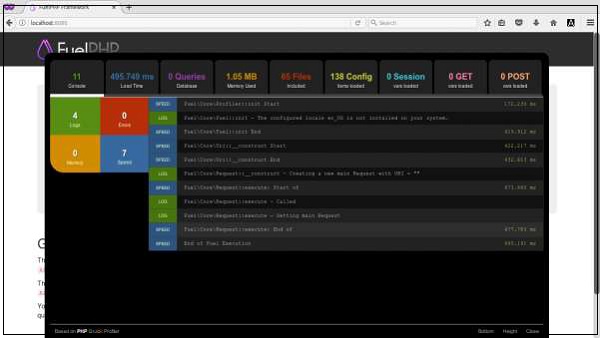
Profiler Information
The Profiler has a tabbed interface and it consists of the following data,
Console − Provides information about errors, log entries, memory usage, or execution timings.
Load time − Shows request load time.
Database − The number of queries executed and the execution time.
Memory − Total memory used for the request.
Files − Shows all PHP files.
Config − Configuration contents at the end of the request.
Session − Session contents at the end of the request.
GET − The contents of the $_GET array.
POST − The contents of the $_POST array.
Profiler Class
The profiler class is used to add your profiling information. It implements a customized version of PHPQuickProfiler (PQP). Profiler contains a collection of javaScript variables to control the initial state of the Profiler.
Profiler class supports the following methods −
mark()
mark method will add a speed marker to the profiler. It shows the load time.
Profiler::mark('my custom code');
mark_memory()
*mark_memory* method adds a memory marker to the profiler. If no input is specified, the memory usage at that point of time is logged. If we specify the variable and a label for the variable as shown below, then it will show the memory usage of the variable and label it using the specified label.
mark_memory($this, 'My Employee Controller memory usage');
console()
The console method will simply add a log entry to the profiler.
Profiler::console('log entry');
