- Excel Power View - Home
- Overview
- Creation
- Sheet
- Visualizations
- Table Visualization
- Matrix Visualization
- Card Visualization
- Chart Visualizations
- Line Chart Visualization
- Bar Chart Visualization
- Column Chart Visualization
- Scatter & Bubble Chart Visualization
- Pie Chart Visualization
- Map Visualization
- Multiple Visualizations
- Tiles Visualizations
- Advanced Features
- Excel Power View and Data Model
- Hierarchies
- Key Performance Indicators
- Formatting a Report
- Sharing
Excel Power View - Table Visualization
In Power View, for every visualization you want to create, you start by creating a Table, which is the default and then convert the Table to other visualizations easily.
The Table looks like any other data table with columns representing fields and rows representing data values. You can select and deselect fields in the Power View Fields list to choose the fields that are to be displayed in the Table. The fields can be from the same data table or from different related data tables.
Creating a Table
To create a Table in Power View, do the following −
- Click on the Power View area.
- Click on the table Results in the Power View Fields list.
- Select the fields Country, Sport, and Medal.
A Table will be displayed on Power View with selected fields as columns, containing the actual values.
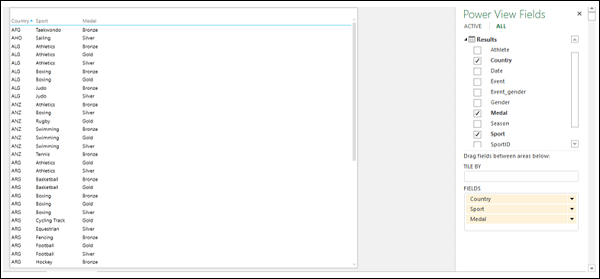
Understanding Table Visualization
You can see that the selected fields appear in the FIELDS area under the Power View Fields list. The columns are formatted according to their data type, as defined in the data model that the report is based on.
The order of the fields in the FIELDS area represents the order of the columns in the Table. You can change the order by dragging the fields in the FIELDS area. You can sort the Table by any column by clicking on the column name. The sort order can be ascending or descending by values.
You can filter the data in the Table by choosing the filtering options in the Filters area, under the Table tab. You can add fields to the Table by dragging the field either to the Table in Power View or to the FIELDS area. If you drag a field to the Power View area and not to the Table, a new Table is displayed.
Adding a Field to Table as Count
Suppose you want to display the Medal Count as a column. You can do it by adding the field Medal to the Table as Count.
- Click the arrow next to the field, Medal, in the Power View Fields list.
- Select Add to Table as Count from the dropdown list.
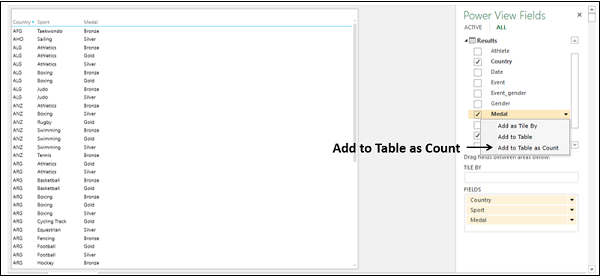
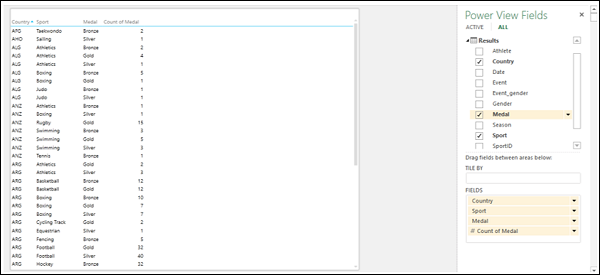
A new column Count of Medal will be added to the Table, displaying the Medal Count values.
Adding a Count Field to Table
As your data has more than 34000 rows, adding the field Medal as Count to the Table is not an efficient approach, as Power View has to do the calculation whenever you change the layout of the Table.
The more effective way is to add a calculated field to the Medals data table in the Data Model.
- Click on the PowerPivot tab on the Ribbon.
- Click on Manage in the Data Model group. The tables in the Data Model will be displayed.
- Click on the Results tab.
- In the Results table, in the calculation area, in the cell below the Medal column, type the following DAX formula
Medal Count:=COUNTA([Medal])
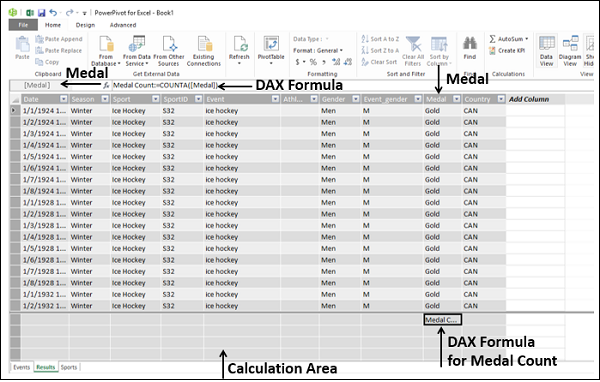
You can see that the medal count formula appears in the formula bar and to the left of the formula bar, the column name Medal is displayed.
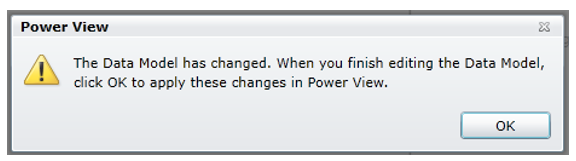
In the Power View sheet, you will get a Power View message that the Data Model is changed and if you click OK, the changes will be reflected in your Power View. Click OK.
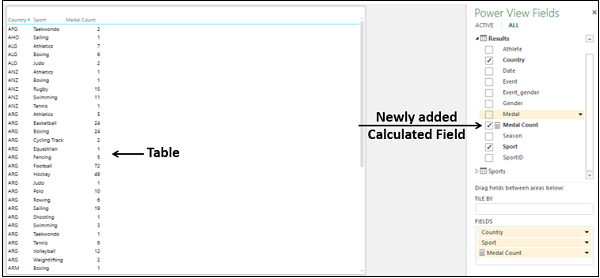
In the Power View Fields list, you can observe the following −
A new field Medal Count is added in the Results table.
A calculator icon appears adjacent to the field Medal Count, indicating that it is a calculated field.
Select the fields Country, Sport, and Medal Count.
Your Power View Table displays the medal count country wise and sport wise.
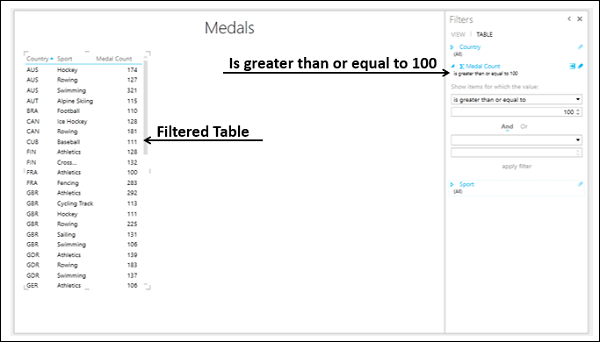
Filtering Table in Power View
You can filter the values displayed in the Table by defining the filter criteria.
- Click the TABLE tab in the Filters area.
- Click Medal Count.
- Click the icon Advanced filter mode to the right of Medal Count.
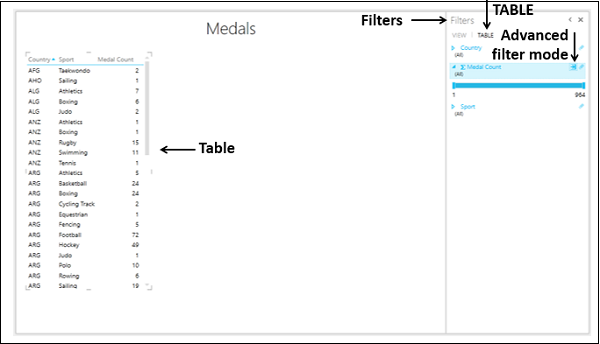
Select is greater than or equal to from the dropdown list under Show items for which the value.
Type 100 in the box below that and then click Apply Filter.
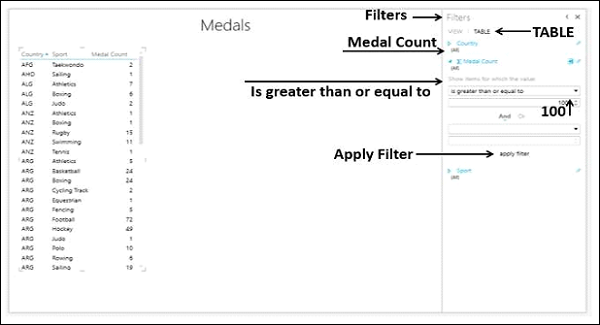
The Table will display only those records with Medal Count >= 100.