- Excel Power View - Home
- Overview
- Creation
- Sheet
- Visualizations
- Table Visualization
- Matrix Visualization
- Card Visualization
- Chart Visualizations
- Line Chart Visualization
- Bar Chart Visualization
- Column Chart Visualization
- Scatter & Bubble Chart Visualization
- Pie Chart Visualization
- Map Visualization
- Multiple Visualizations
- Tiles Visualizations
- Advanced Features
- Excel Power View and Data Model
- Hierarchies
- Key Performance Indicators
- Formatting a Report
- Sharing
Excel Power View - Card Visualization
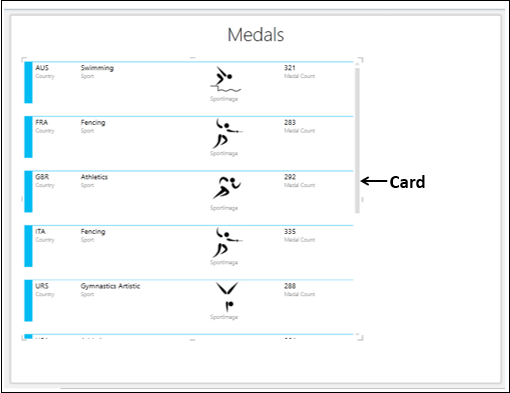
In a Card visualization, you will have a series of snapshots that display the data from each row in the table, laid out like an index card.
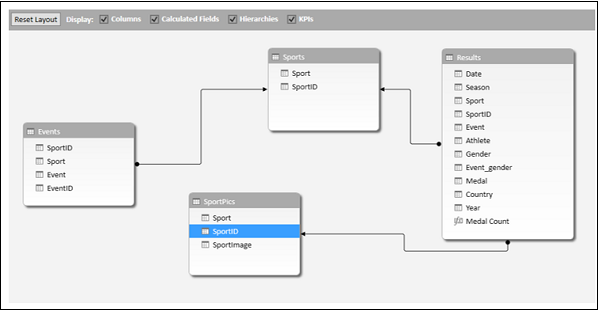
Consider the Data Model, where we have added the table SportPics.
You need to start with a Table and then convert it to Card.
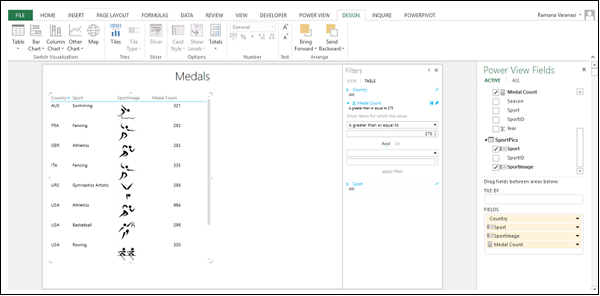
Choose the fields − Country, Sport, SportImage and Medal Count. The Table representing these fields appears in Power View.
Filter the Table to display data with Medal Count more than 275.
The values in the column SportImage are images. It is possible to add images to your Power View visualizations. The images are data bound, i.e. a sport image is linked to the corresponding sport. You will learn more about images in subsequent chapters.
Switching to Card Visualization
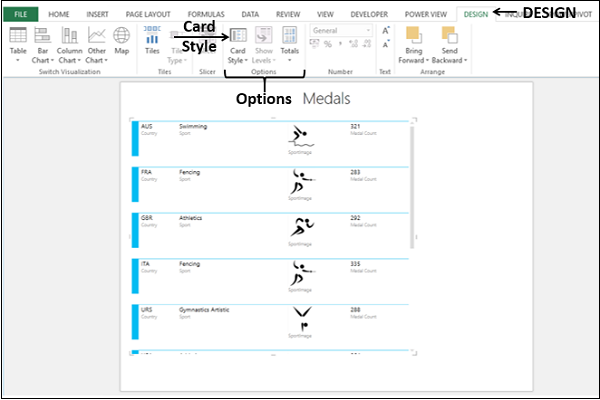
Convert the Table to a Card as follows −
- Click on the Table.
- Click the DESIGN tab.
- Click Table in the Switch Visualization group.
- Select Card from the dropdown list.
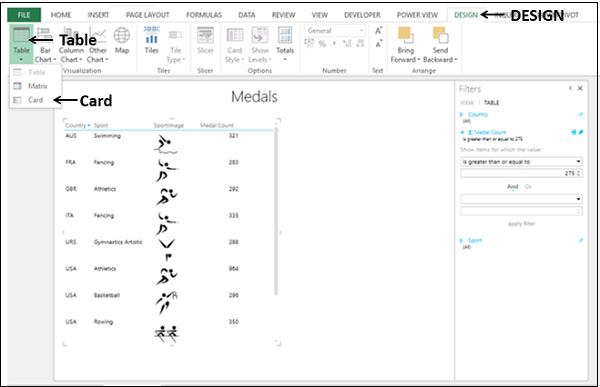
The Table is converted to Card visualization.
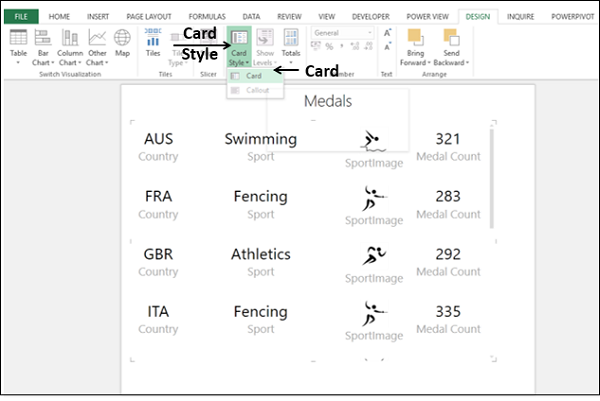
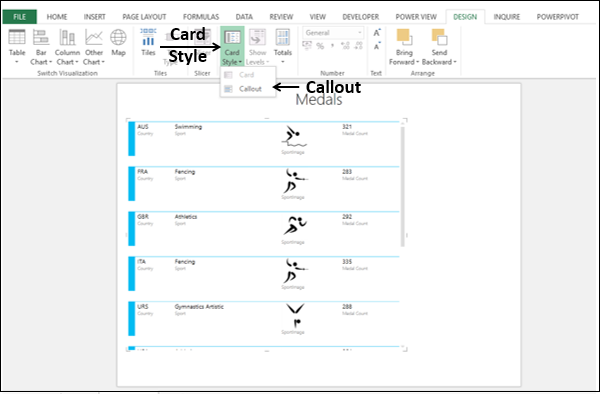
Card Style
You have two Card Styles for Card visualization.
- Card
- Callout
The Card Style that you have in the previous section is Card, is the default style.
To convert the Card Style to Callout do the following −
- Click on the Card.
- Click the Design tab on the Ribbon.
- Click Card Style in the Options group.
Select Callout from the dropdown list.
The Card Style changes from Card to Callout.
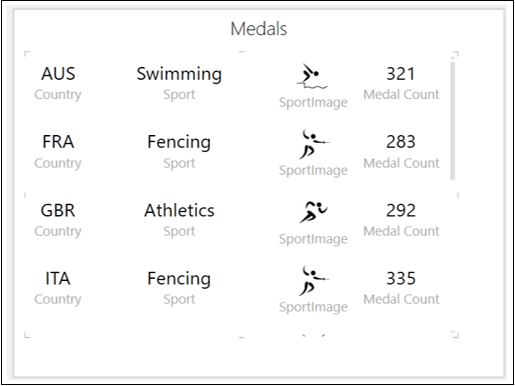
In the Callout Card Style, all the text is displayed in large font. You can change the Card Style back to Card as follows −
- Click on Card Style.
- Select Card from the dropdown list.