- Excel Power View - Home
- Overview
- Creation
- Sheet
- Visualizations
- Table Visualization
- Matrix Visualization
- Card Visualization
- Chart Visualizations
- Line Chart Visualization
- Bar Chart Visualization
- Column Chart Visualization
- Scatter & Bubble Chart Visualization
- Pie Chart Visualization
- Map Visualization
- Multiple Visualizations
- Tiles Visualizations
- Advanced Features
- Excel Power View and Data Model
- Hierarchies
- Key Performance Indicators
- Formatting a Report
- Sharing
Excel Power View - Matrix Visualization
Matrix visualization is similar to a Table visualization in that it also contains rows and columns of data. However, a Matrix has additional features such as hierarchy, not repeating values, etc.
As you have learnt in the previous chapters, you need to start with a Table and then convert it to Matrix.
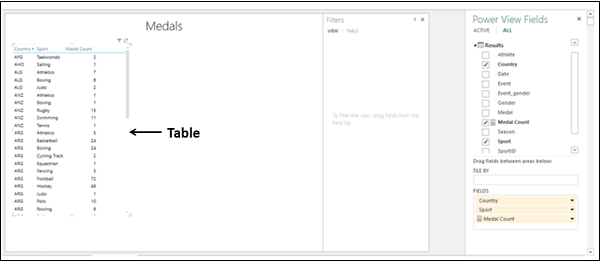
Choose the fields Country, Sport, and Medal Count. A Table representing these fields appears in Power View.
Switching to Matrix Visualization
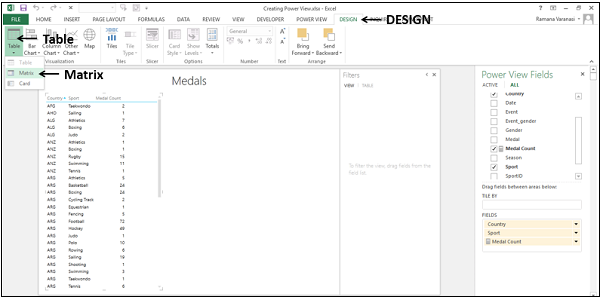
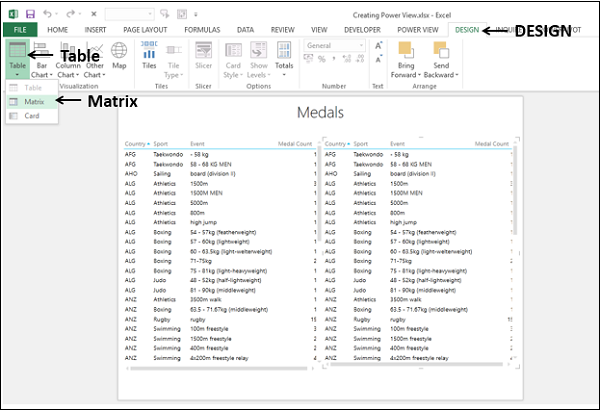
Convert the Table to Matrix as follows −
- Click on the Table.
- Click the DESIGN tab.
- Click Table in the Switch Visualization group.
- Select Matrix from the dropdown list.
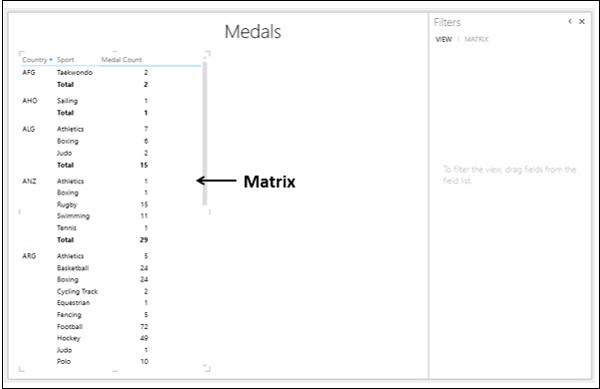
The Table is converted to Matrix.
Advantages of Matrix Visualization
A Matrix has the following advantages −
- It can display the data without repeating values.
- It can display totals and subtotals by columns and/or rows.
- If it contains a hierarchy, you can drill down/drill up.
- It can be collapsed and expanded by rows and/or columns.
Combination of Table and Matrix Visualizations
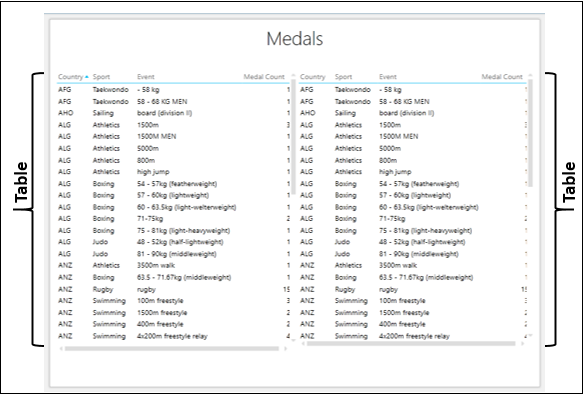
You can see the differences between the Table and Matrix visualizations by having them side by side on the Power View sheet, displaying the same data.
Follow the steps given below −
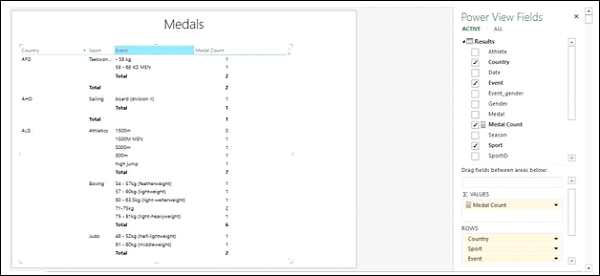
Create a Table with the fields Country, Sport, Event, and Medal Count.
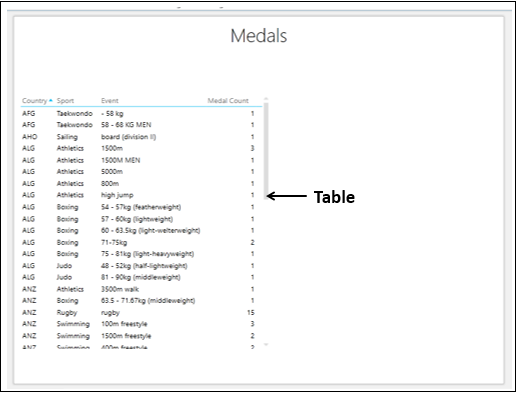
In the Table, the values of country repeated for several sport values and the values of sport are repeated for several event values.
Create another Table on the right side of the first Table as follows −
Click on the Power View sheet in the space to the right of the Table.
Select the fields Country, Sport, Event, and Medal Count.
Another Table representing these fields appears in Power View, to the right of the earlier Table.
Click the Table on the right.
Click the DESIGN tab on the Ribbon.
Click Table in the Switch Visualization group.
Select Matrix from the dropdown list.
The Table on the right in Power View is converted to Matrix.
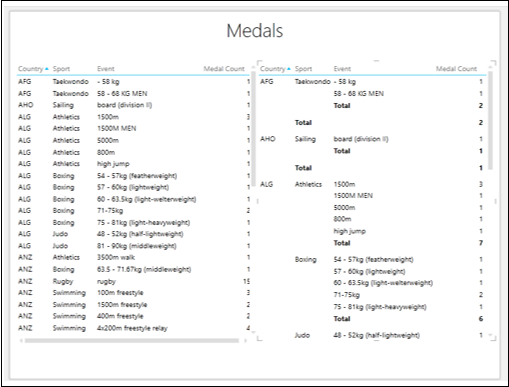
As you can observe, the Matrix displays each country and sport only once, without repeating values as is the case in Table.
Filtering Matrix in Power View
You can explore the data to find the countries and the corresponding sports and events with medal count of more than 150.
Click on the Table.
In the Filters area, click the TABLE tab.
Set the filtering criteria for Medal Count as - is greater than or equal to 150.
Click Apply filter
Click Matrix.
In the Filters area, click the MATRIX tab.
Set the filtering criteria for Medal Count as - is greater than or equal to 150.
Click Apply filter.
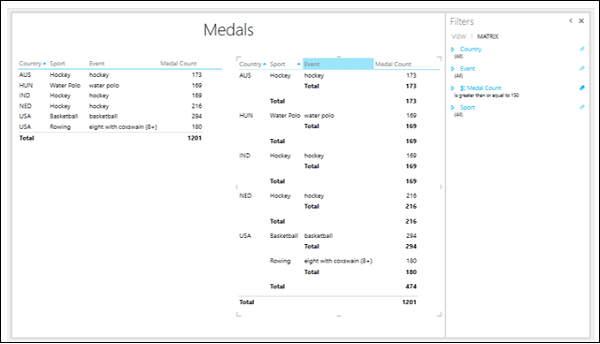
In Matrix, data is displayed without repeating the values, whereas in Table data is displayed with repeated values.
Totals
To understand the capability of Matrix in displaying Subtotals and Totals, do the following −
Add the fields Country, Sport, Event and Medal Count to Matrix.
As you can see, the fields Country, Sport, and Event define the hierarchy and are nested in that order. Matrix also displays Subtotals at each of these Levels as shown below.
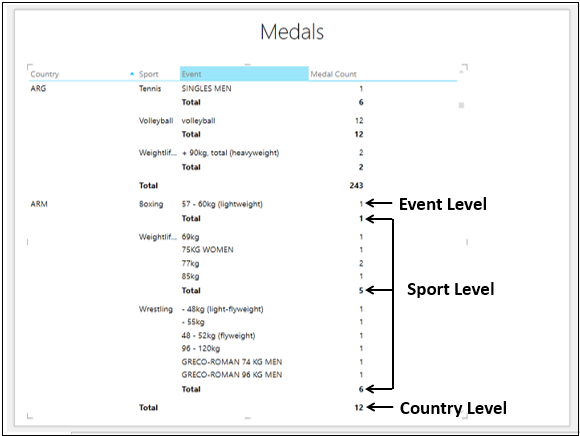
The Subtotals and Total are given as follows −
Medal Count is at the Event Level.
Subtotal at the Sport Level Sum of the Medal Count values of all Events in that Sport won by the Country that is one Level up.
Subtotal at the Country Level Sum of the Subtotals at Sport Level.
At the bottom of the Matrix, the Total row is displayed that sums up all the Medal Count values.
Look at a variation of the same Matrix −
- Add the fields Country, Sport, and Medal Count to Matrix.
- Filter the Matrix to display only values with Medal Count more than 250.
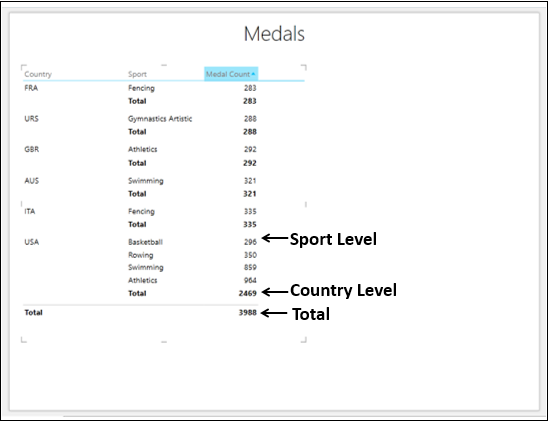
The Medal Count values are displayed as follows −
At Sport Level − Total Medal Count of all the Medal Counts at Event Levels in the Sport.
At Country Level − Subtotal of all the Medal Count values at Sport Levels in the Country.
Total Row − Total of all the Subtotals of all the Countries.
If you do not want to display the Subtotals and Total rows in Matrix, do the following −
Click on the Matrix.
Click the DESIGN tab.
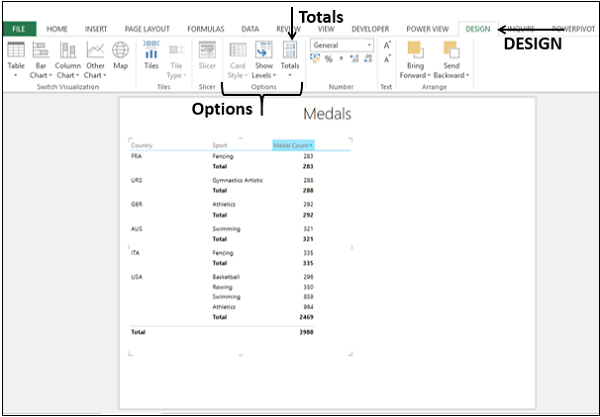
Click Totals in the Options group.
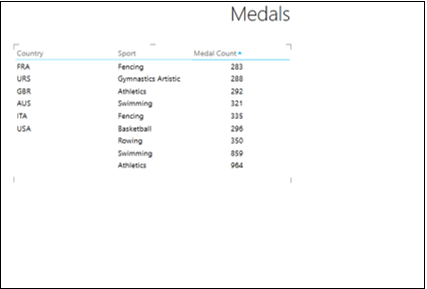
Select None from the dropdown list.
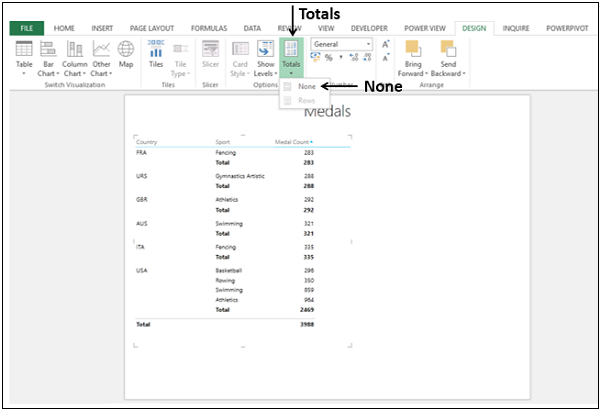
Totals will not be displayed.
To display the Subtotals and total again, do the following
- Click on the Matrix.
- Click the DESIGN tab.
- Click Totals in the Options group.
- Select Rows from the dropdown list.
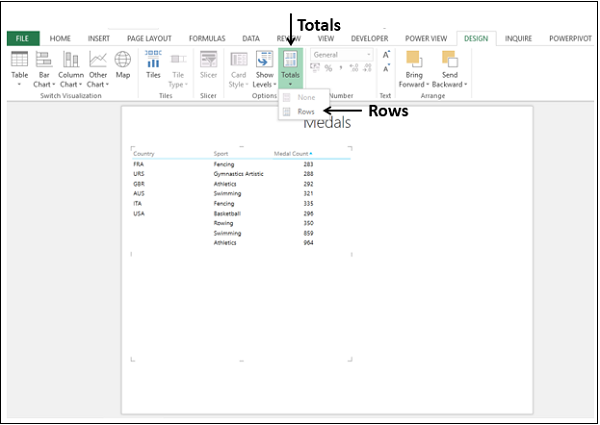
The Rows with Subtotals and Total will be displayed. As you can see, this is the default mode in Matrix.
