- Excel Power View - Home
- Overview
- Creation
- Sheet
- Visualizations
- Table Visualization
- Matrix Visualization
- Card Visualization
- Chart Visualizations
- Line Chart Visualization
- Bar Chart Visualization
- Column Chart Visualization
- Scatter & Bubble Chart Visualization
- Pie Chart Visualization
- Map Visualization
- Multiple Visualizations
- Tiles Visualizations
- Advanced Features
- Excel Power View and Data Model
- Hierarchies
- Key Performance Indicators
- Formatting a Report
- Sharing
Excel Power View - Formatting a Report
Once your data visualization and data exploration is complete, you will be ready to produce reports for presentation. Power View provides a wide range of Themes, Chart Palettes, Fonts, Background Colors, etc. that can help you make your reports appealing. In this chapter, you will learn about the various formatting features of Power View.
You know that it is possible to have a combination of Power View visualizations on a single Power View report. Some of the formatting options enable you to apply the same feature for the entire view and some options can be set separately for each of the visualizations. Further, some options will get replicated to all the Power View sheets in your workbook, while some would not.
The formatting features in Power View enable you to do the following −
- Change the theme.
- Add background image.
- Choose background formatting.
- Change the text size.
- Change the font.
- Format numbers in Table, Matrix or Card.
Changing Theme
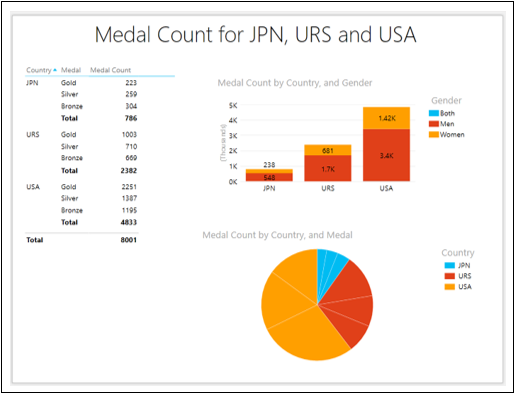
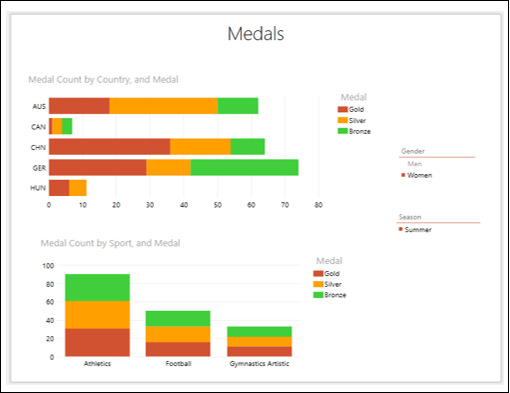
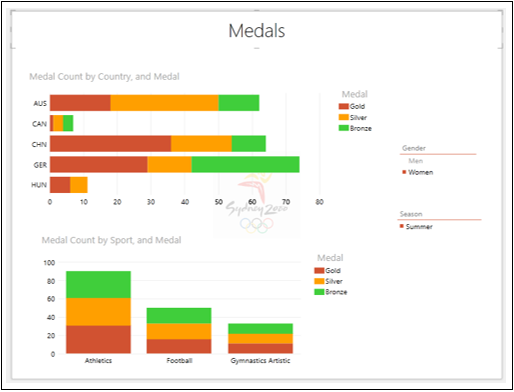
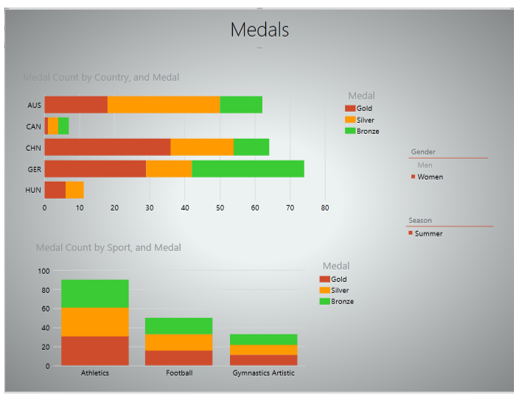
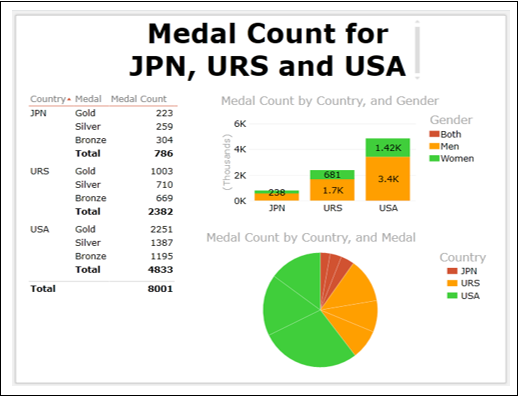
Consider the following Power View report −
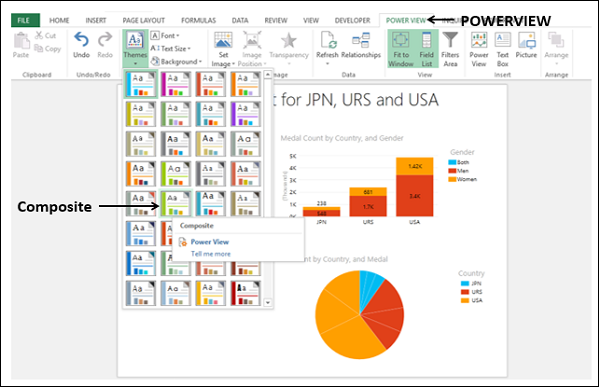
Change the Theme as follows −
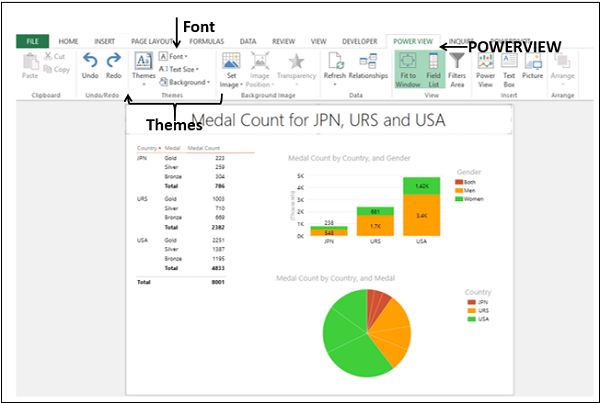
- Click the POWERVIEW tab on the Ribbon.
- Click Themes in the Themes group.
- Select Composite from the dropdown gallery.
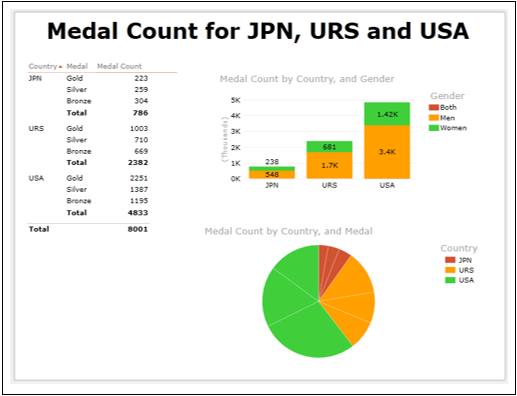
The Theme of the Power View report changes to the selected one.
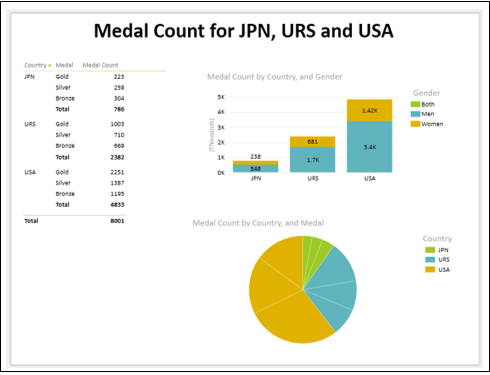
A theme has a unique set of colors and fonts for creating a look and feel for the entire report. You can choose the theme that best suits your data, context, the background of the presentation, etc.
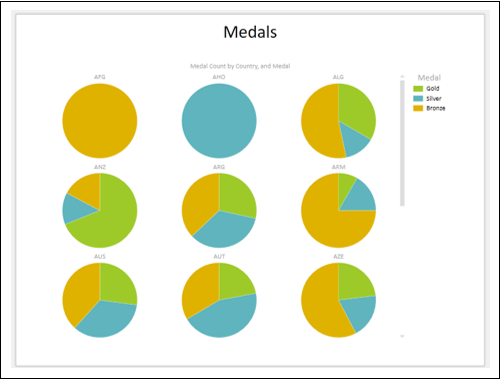
Click in another Power View sheet in your workbook. You can observe that the new theme is applied to all the Power View sheets in the workbook.
Setting Background Image
You can add a background image in your Power View report, adjust its position, size and transparency.
Consider the following Power View report that is filtered to show the results only for the year 2000.
In 2000, Olympics were held in Sydney. You can add the respective emblem to your Power View report as follows −
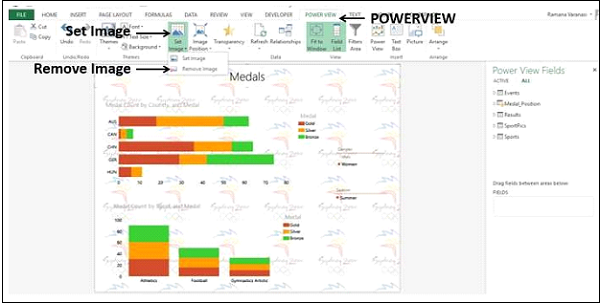
Click the POWERVIEW tab on the Ribbon.
Click Set Image in the Background Image group.
Select Set Image from the dropdown list.
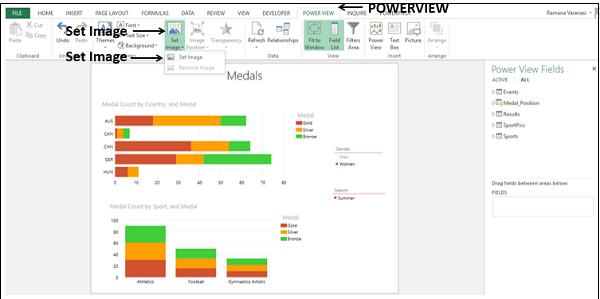
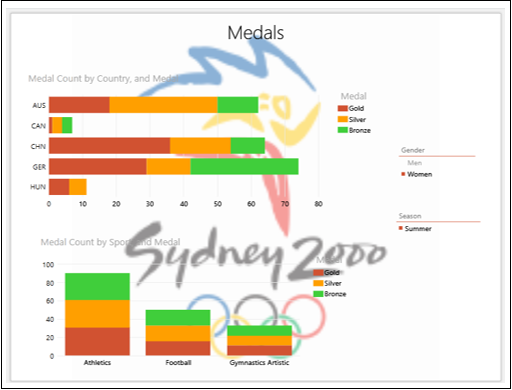
Browse for the image file and open it. The image appears as a background image in the Power View report.
You can resize the background image in several ways −
Stretch to occupy the entire Power View canvas. However, the aspect ratio might be lost and is not allowed for certain images.
Tile to cover the entire Power View Canvas with multiple copies of the image.
Center align the image.
Fit to display with the right aspect ratio and cover the Power View canvas. This is also the by default, Fit option.
The Center alignment option looks as shown below.

You can specify the transparency of the background image. By default, it is 50%. The higher the percentage, the more transparent (less visible) the image.
Click the POWERVIEW tab.
Click Transparency in the Background Image group.
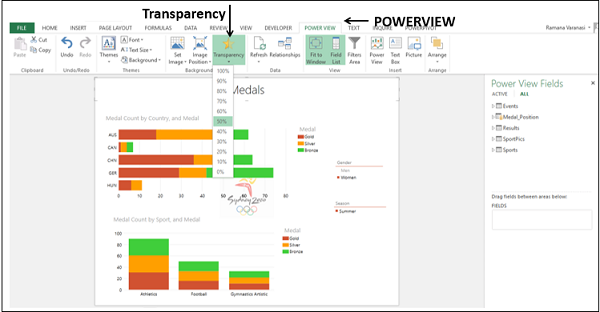
Select 80% from the dropdown list.
Change the Image Position to Tile.
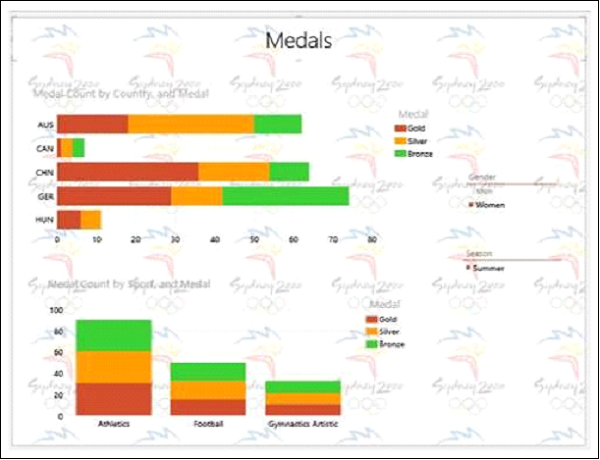
You can observe that the background image is set only for this Power View sheet and is not replicated in other Power View sheets in your workbook.
You can remove the background image that you have set.
Click the POWERVIEW tab on the Ribbon.
Click Set Image in the Background Image group.
Select Remove Image from the dropdown list.
The background image will be removed.
Changing Background Colors
You can change the background colors in the Power View report.
Click the POWERVIEW tab on the Ribbon.
Click Background in the Themes group. You will find different backgrounds in the gallery, from solids to a variety of gradients. By default, it is white.
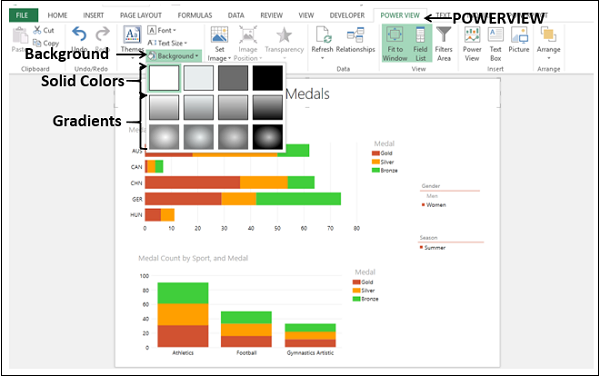
Click Light2 Center Gradient. The background color changes to the selected one.
The selected background color will be applied to all the Power View sheets in your workbook.
Changing Font in a Power View Report
You can change the Font in the Power View report.
Click the Power View tab on the Ribbon.
Click Font in the Themes group.
Select Verdana from the dropdown list.
The font is changed in all the visualizations. You can have only one font for all the visualizations in your Power View report.
Note − The font has not changed in the other Power View sheets in your workbook.
Changing Text Size in a Power View Report
You can change the size of text to a percentage of the original text size in your Power View report.
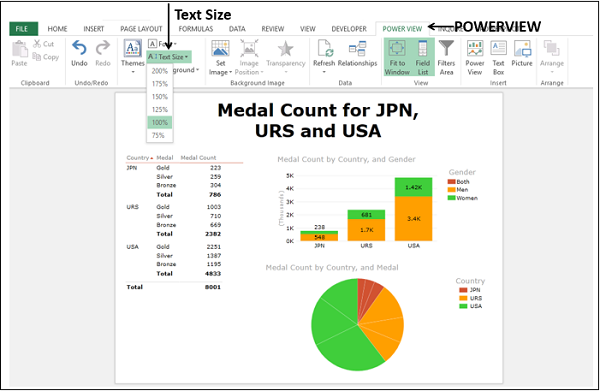
- Click the Power View tab on the Ribbon.
- Click Text Size in the Themes group. By default, it is 100%. Select 125%.
The font size of the text in the entire Power View report will be enlarged.
Adjust the sizes of the visualizations and the title so that they will be conspicuous.
You can see that the text in the visualizations have become more readable.
Note − The text size would be the same in all the visualizations in the report and all the other Power View sheets in your workbook as well.
Formatting Numbers in a Power View Report
You can format numbers in Table, Matrix and Card visualizations.
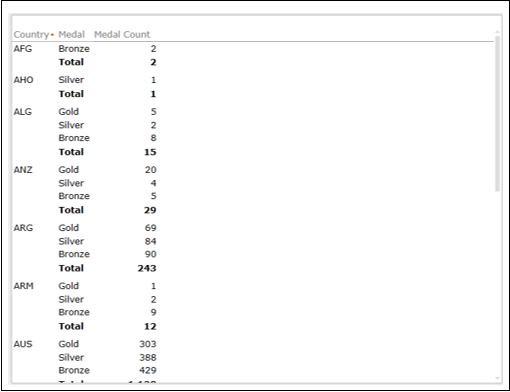
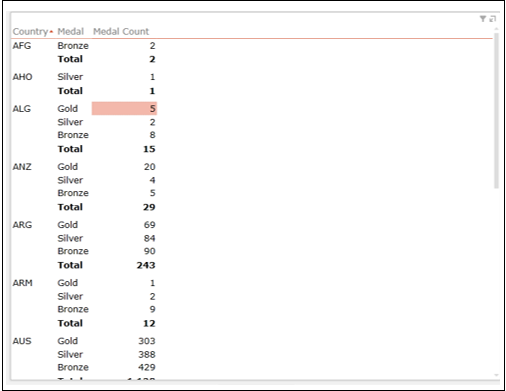
- Create a Table with the fields Country, Medal and Medal Count.
- Switch to Matrix visualization.
Click on a value in the Medal Count column in the Matrix.
Click the DESIGN tab on the Ribbon.
Select Number from the dropdown list in the Number group.
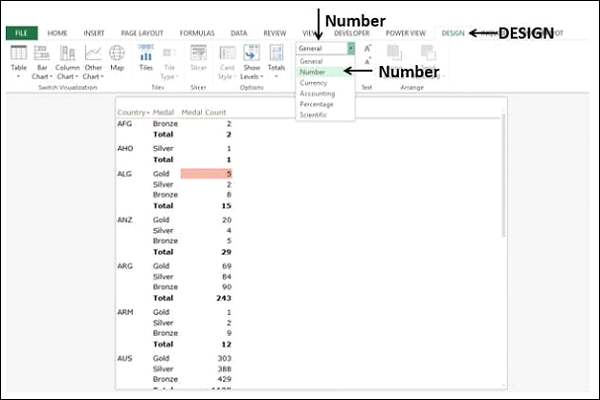
The entire column will be formatted to number.
Click Decrease Indent in the Number group twice.
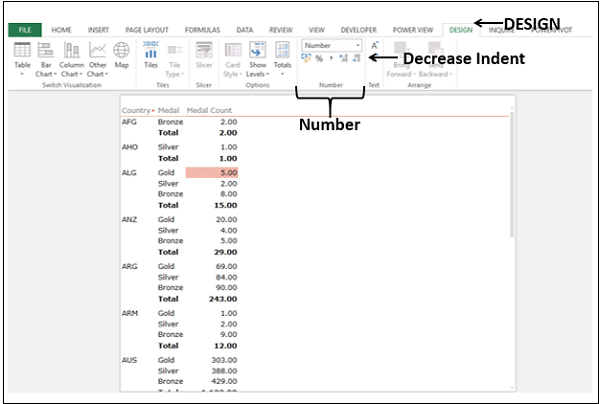
The data will be displayed in Number format. You can format numbers in Table and Card visualizations also.
Changing Number Aggregates
In the Power View Fields list, some number fields will have a Sigma symbol next to them. They are aggregates, meaning that you can combine the values in that field to yield a numeric value such as sum, count, or average. You can aggregate a numeric or text (non-numeric) field. However, you cannot aggregate a calculated field.
Create a Table with the fields Country and Medal Position.
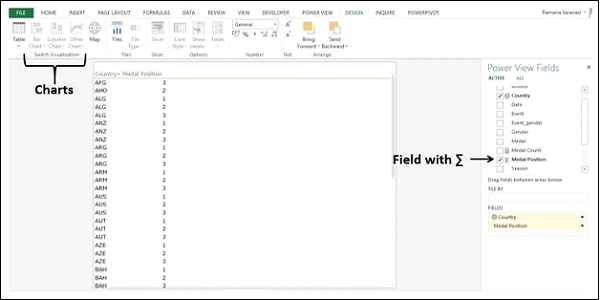
Suppose you want to switch visualization to Stacked Bar Chart. But, as you can observe, the Chart visualizations are grayed out and disabled. You can also observe that the field Medal Position has symbol next to it, meaning that it can be aggregated.
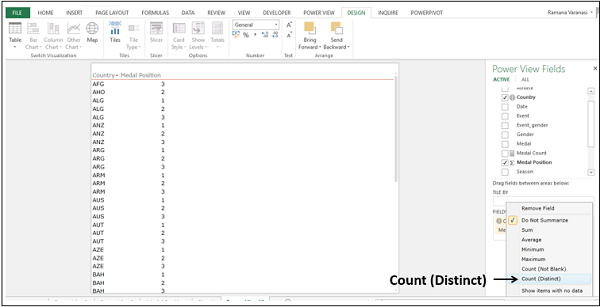
Click the drop-down arrow next to field Medal Position in the FIELDS area.
Select Count (Distinct) from the dropdown list.
The field Medal Position displays a # symbol meaning it is count. In the Table, the column header changes to Count of Medal Position and the rows for each Country are displayed only once showing the count values.
On the Ribbon, Chart options will be enabled.
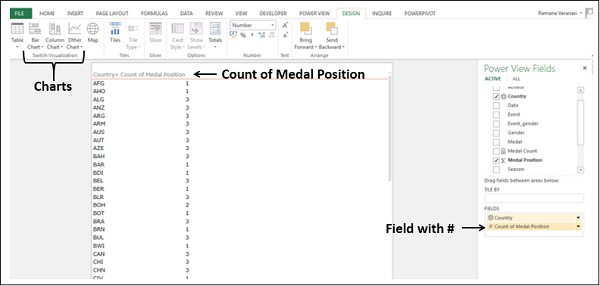
Now, you can switch visualization to Stacked Bar Chart. In a similar way, you can aggregate a text field also. This feature comes handy if you do not have numeric fields in your data.
