- Excel Charts - Home
- Excel Charts - Introduction
- Excel Charts - Creating Charts
- Excel Charts - Types
- Excel Charts - Column Chart
- Excel Charts - Line Chart
- Excel Charts - Pie Chart
- Excel Charts - Doughnut Chart
- Excel Charts - Bar Chart
- Excel Charts - Area Chart
- Excel Charts - Scatter (X Y) Chart
- Excel Charts - Bubble Chart
- Excel Charts - Stock Chart
- Excel Charts - Surface Chart
- Excel Charts - Radar Chart
- Excel Charts - Combo Chart
- Excel Charts - Chart Elements
- Excel Charts - Chart Styles
- Excel Charts - Chart Filters
- Excel Charts - Fine Tuning
- Excel Charts - Design Tools
- Excel Charts - Quick Formatting
- Excel Charts - Aesthetic Data Labels
- Excel Charts - Format Tools
- Excel Charts - Sparklines
- Excel Charts - PivotCharts
Excel Charts - Format Tools
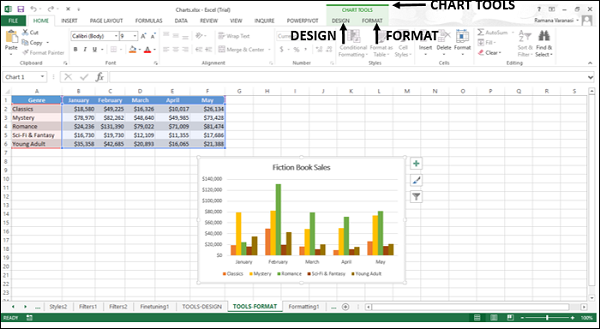
The CHART TOOLS menu comprises of two tabs DESIGN and FORMAT.
When you click on a chart, a new tab CHART TOOLS comprising of DESIGN and FORMAT tabs appear on the Ribbon.
Click the FORMAT tab on the Ribbon. The Ribbon changes to the FORMAT commands.
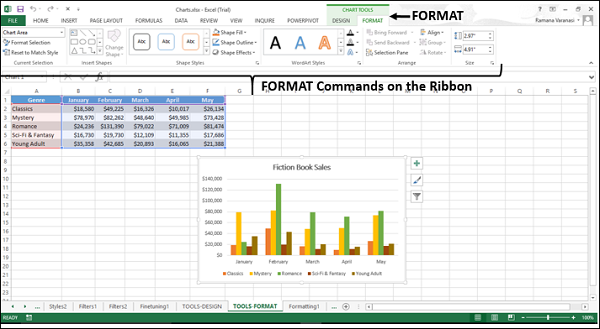
The Ribbon contains the following format commands −
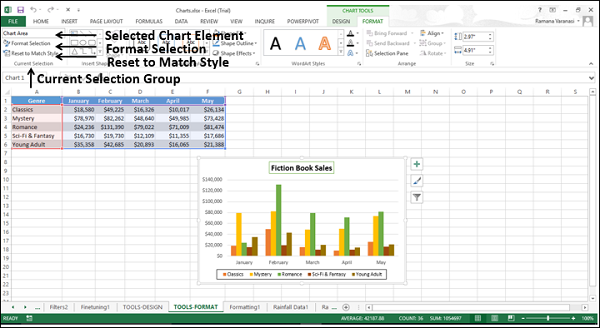
Current Selection Group
Chart Element Selection Box
Format Selection
Reset to Match Style
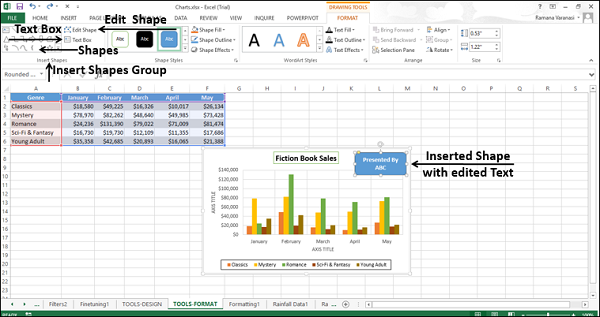
Insert Shapes Group
Different Shapes to Insert
Change Shape
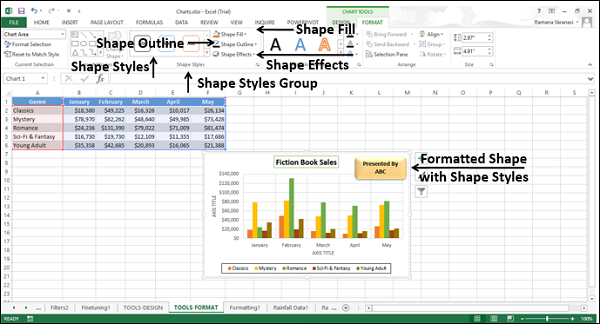
Shape Styles Group
Shape Styles
Shape Fill
Shape Outline
Shape Effects
WordArt Styles
WordArt Styles
Text Fill
Text Outline
Text Effects
Arrange Group
Bring Forward
Send Backward
Selection Pane
Align
Group
Rotate
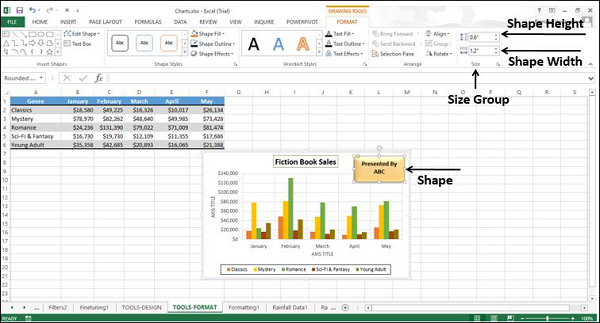
Size Group
Shape Height
Shape Width
Current Selection Group
You can format chart elements using the Current Selection Group commands.
For formatting your charts through the Ribbon, follow the given steps.
Step 1 − Select the chart element you want to format. It appears in the box provided at the top of the group.
Step 2 − Click Format Selection. The Format pane appears for the selected chart element.
Step 3 − Format the selected chart element using the options in the format pane.
Refer chapter − Formatting Charts Quickly in this Tutorial.
Insert Shapes Group
You can insert different shapes in your chart selecting the shapes. After you insert a shape, you can add text to it, with Edit Text.
You can edit shape with −
- Change Shape
- Edit Points
Shape Styles Group
You can change the style of the shape, choosing the given styles −
- You can choose a Shape Fill Color.
- You can Format Shape Outline.
- You can add Visual Effects to the Shape.
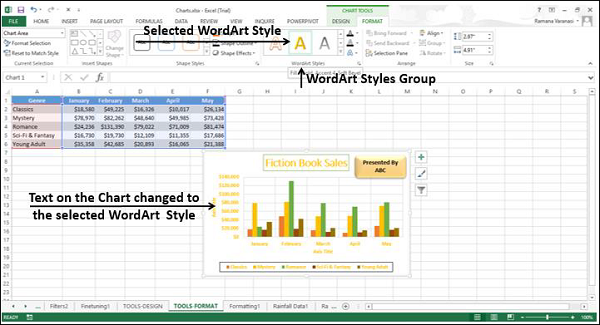
WordArt Styles Group
You can use the word art to change the way your chart is displayed. The available options are −
Fill the text with a color with the Text Fill command.
Customize the Text Outline.
Add visual effects to the text with Text Effects.
Arrange Group
The Arrange Group commands are used to select the objects on your chart, change the order or visibility of the selected objects.
To see the objects that are present on your chart, click the selection pane command. The selection pane appears listing the objects available on your chart.
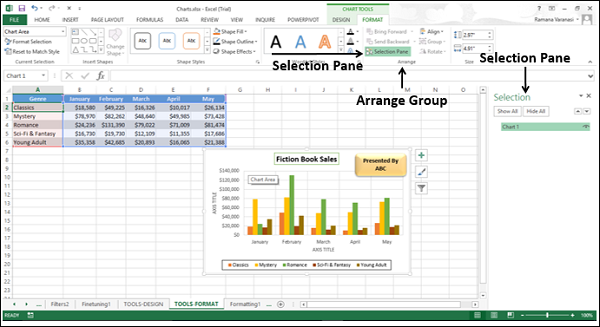
Select the objects and then you can do the following with the selected objects −
- Bring Forward
- Send Backward
- Selection Pane
- Align
- Group
- Rotate
Size Group
The Size Group commands are used to change the width or the height of the shape or picture on the chart. You can use the shape height box and shape width box to change the height and weight respectively of a shape or picture.