- Excel Charts - Home
- Excel Charts - Introduction
- Excel Charts - Creating Charts
- Excel Charts - Types
- Excel Charts - Column Chart
- Excel Charts - Line Chart
- Excel Charts - Pie Chart
- Excel Charts - Doughnut Chart
- Excel Charts - Bar Chart
- Excel Charts - Area Chart
- Excel Charts - Scatter (X Y) Chart
- Excel Charts - Bubble Chart
- Excel Charts - Stock Chart
- Excel Charts - Surface Chart
- Excel Charts - Radar Chart
- Excel Charts - Combo Chart
- Excel Charts - Chart Elements
- Excel Charts - Chart Styles
- Excel Charts - Chart Filters
- Excel Charts - Fine Tuning
- Excel Charts - Design Tools
- Excel Charts - Quick Formatting
- Excel Charts - Aesthetic Data Labels
- Excel Charts - Format Tools
- Excel Charts - Sparklines
- Excel Charts - PivotCharts
Excel Charts - Aesthetic Data Labels
You can have aesthetic and meaningful data labels. You can −
Include rich and refreshable text from data points or any other text in your data labels.
Enhance them with formatting and additional freeform text.
Display them in just about any shape.
Data labels stay in place, even when you switch to a different type of chart. You can also connect the data labels to their data points with leader lines on all charts.
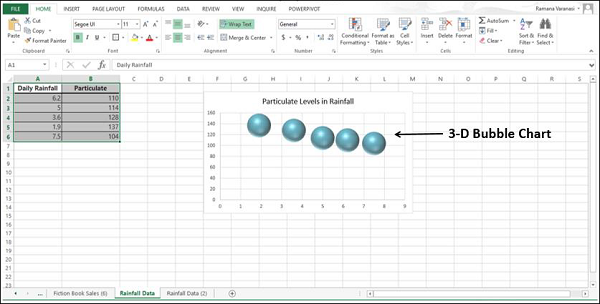
Here, we will use a Bubble chart to see the formatting of data labels.
Data Label Positions
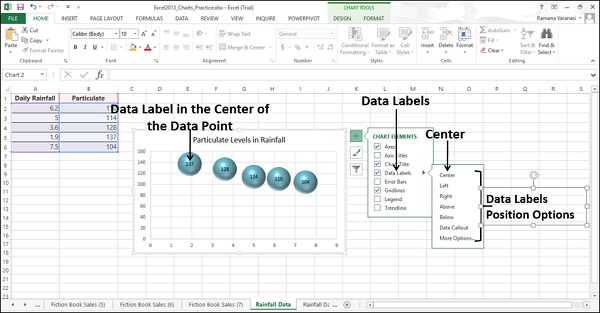
To place the data labels in the chart, follow the steps given below.
Step 1 − Click the chart and then click chart elements.
Step 2 − Select Data Labels. Click ![]() to see the options available for placing the data labels.
to see the options available for placing the data labels.
Step 3 − Click Center to place the data labels at the center of the bubbles.
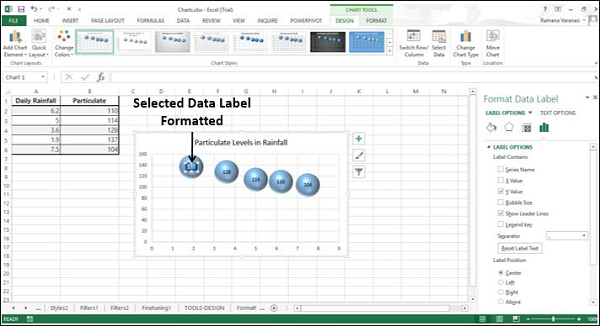
Format a Single Data Label
To format a single data label −
Step 1 − Click twice any data label you want to format.
Step 2 − Right-click that data label and then click Format Data Label. Alternatively, you can also click More Options in data labels options to display on the Format Data Label task pane.

There are many formatting options for data labels in the format data labels task pane.

Step 3 − Format the data label choosing the options you want. Make sure that only one data label is selected while formatting.
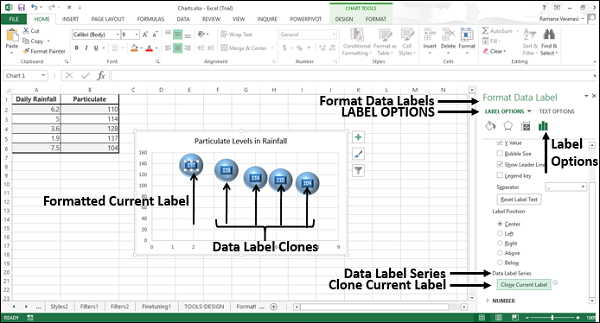
Clone Current Label
To clone the data label created, follow the steps given −
Step 1 − In the Format Data Labels pane, click the Label Options icon.
Step 2 − Under Data Label Series, click Clone Current Label. This will enable you to apply your custom data label formatting quickly to the other data points in the series.
Data Labels with Effects
You can opt for many things to change the look and feel of the data label like changing the Fill Color of the data label for emphasis etc. To format the data labels −
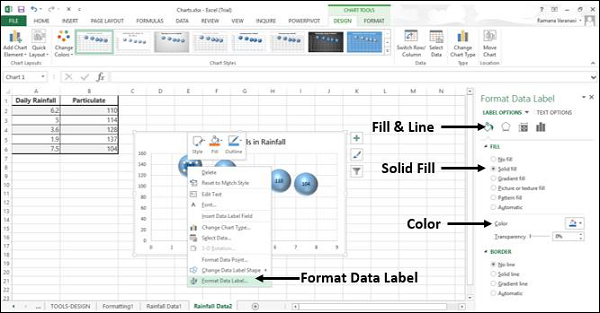
Step 1 − Right-click a data label and then click Format Data Label. The Format Pane - Format Data Label appears.
Step 2 − Click the Fill & Line icon. The options for Fill and Line appear below it.
Step 3 − Under FILL, Click Solid Fill and choose the color. You can also choose the other options such as Gradient Fill, Pattern & Texture Fill and so on.
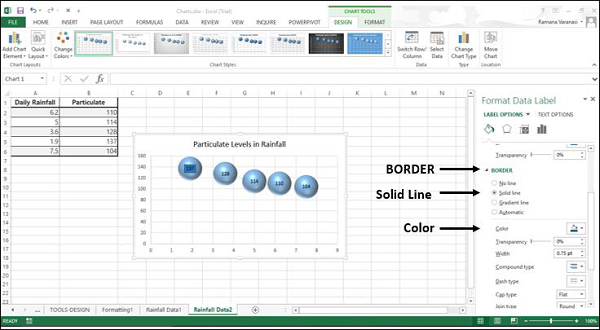
Step 4 − Under BORDER, click Solid Line and choose color.
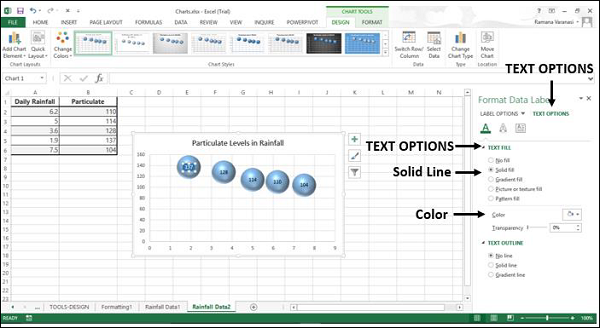
Step 5 − Click the TEXT OPTIONS tab.
Step 6 − Click Solid Fill under the TEXT FILL option.
Step 7 − Choose a color that is compatible to your data label color.
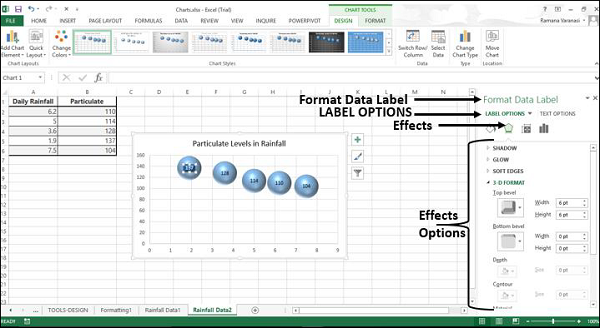
You can give your data Label a 3-D look with the Effects option.
Step 8 − Click Effects and choose the required effects.
Under Label Options, click Clone Current Label. All the data labels in the series get formatted with the look and feel of the initially chosen data label.

Shape of a Data Label
You can personalize your chart by changing the shapes of your data label.
Step 1 − Right-click the data Label you want to change.
Step 2 − Click Change Data Label Shape in the drop-down List. Various data label shapes appear.
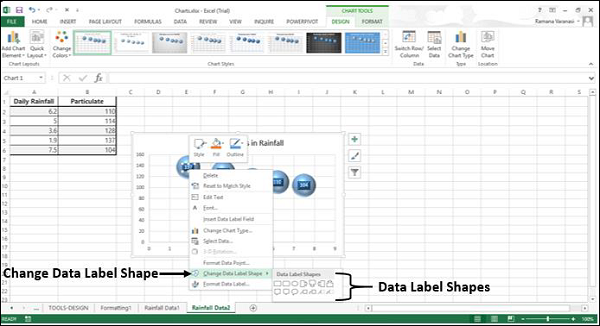
Step 3 − Choose the shape you want. The data labels will appear with the chosen shape.
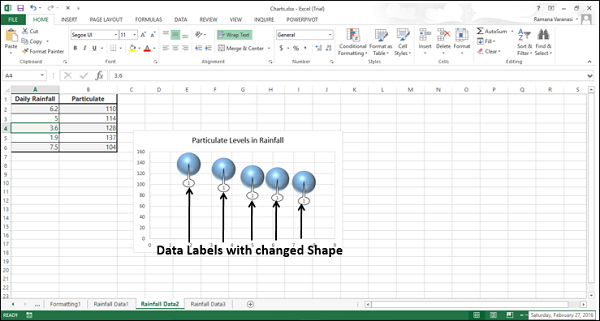
You can observe that the data labels are not completely visible. To make them visible, resize the data labels.
Resize a Data Label
To resize a data label −
Step 1 − Click on any data label.
Step 2 − Drag the border to the size you want. Alternatively, you can click on Size & Properties icon in Format data Labels task pane and then choose the size options.
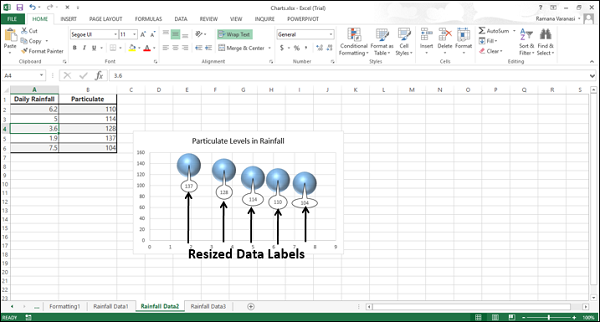
As you can see, the chart with the resized data labels, the data labels in a series can have varying sizes.
Add a Field to a Data Label
You can add a field to a data label. The corresponding field can contain explanatory text or a calculated value.
Step 1 − Place the explanatory text in a cell.
Step 2 − Click the data label, to which you want add the field. All the data labels in the series are selected.
Step 3 − Click again the data label, to which you want add the field. Now, only that particular data label is selected.
Step 4 − Right click the data label. In the drop-down list, click Insert Data Label Field.
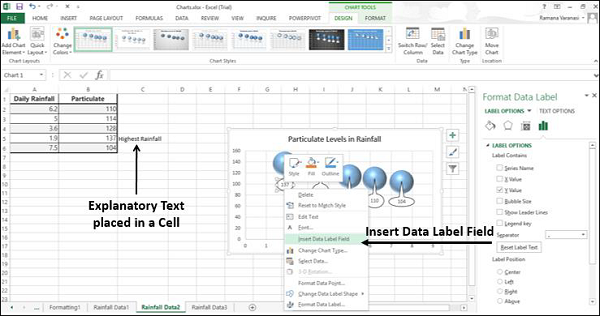
Various field options appear as shown in the image given below.
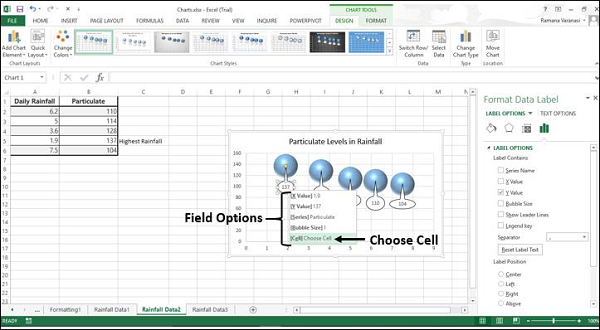
Step 5 − Click Choose Cell. A Data Label Reference window appears.
Step 6 − Select reference of the cell with the explanatory text and click OK.
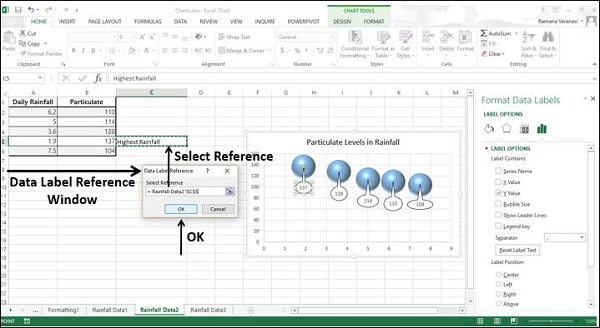
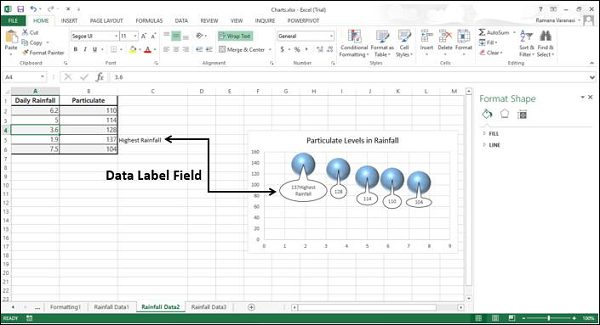
The explanatory text appears in the data label.
Step 7 − Resize the data Label to view the entire text.
Connecting Data Labels to Data Points
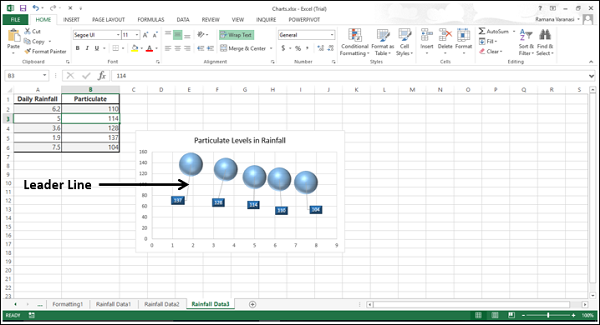
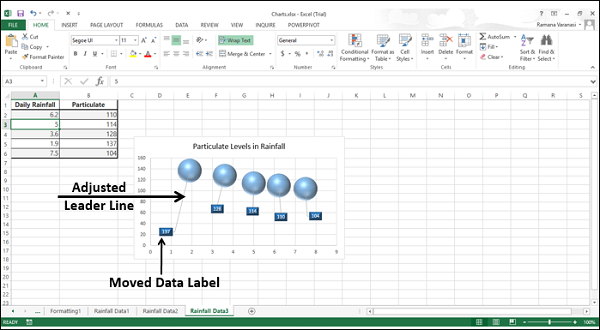
A Leader line is a line that connects a data label and its associated data point. It is helpful when you have placed a data label away from a data point.
All chart types with data labels have this functionality from Excel 2013 onwards. In earlier versions of Excel, only Pie charts had this functionality.
Step 1 − Click the data label.
Step 2 − Drag it after you see a four headed arrow. The Leader line appears.
Step 3 − Repeat Step 1 and 2 for all the data labels in the series. You can see the Leader lines appear for all the data labels.
Step 4 − Move the data label. The Leader line automatically adjusts and follows it.
Format Leader Lines
You can format the Leader lines so that they are displayed the way you want in your chart.
Step 1 − Right click the Leader line you want to format and then click Format leader lines.
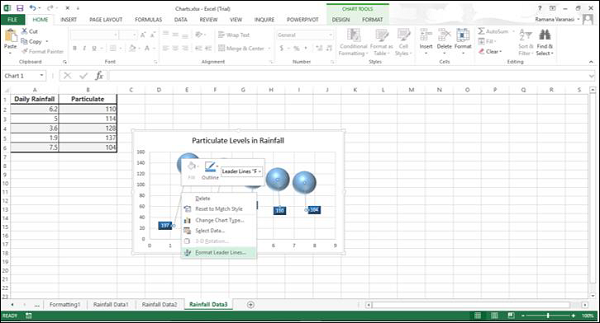
The Format pane - Format Leader Lines appears.
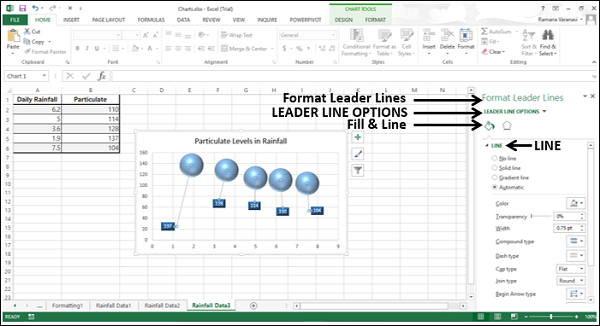
Step 2 − Click the Fill & Line icon.
Step 3 − Under the Line option, choose the options to display the leader line in a manner you want. The leader lines will be formatted as per your choices.
