- Crystal Reports - Home
- Crystal Reports - Overview
- Crystal Reports - GUI Navigation
- Crystal Reports - Options
- Crystal Reports - Page Layout
- Crystal Reports - Getting Help
- Crystal Reports - Design Environment
- Crystal Reports - Data Sources
- Crystal Reports - Queries
- Query Filters & Filter Conditions
- Crystal Reports - Time Based Filters
- Field Objects Controls & Modifications
- Crystal Reports - Sections
- Crystal Reports - Delete Sections
- Crystal Reports - Groups
- Crystal Reports - Group Options
- Crystal Reports - Templates
- Crystal Reports - Inserting Objects
- Crystal Reports - Charts
- Crystal Reports - Cross Tab Layout
- Crystal Reports - Defining Formulas
- Crystal Reports - Formula Workshop
- Creating & Modifying Formulas
- Crystal Reports - Apply Boolean Formulas
- Crystal Reports - If-Then-Else
- Crystal Reports - Applying Calculations
- Crystal Reports - Conditional Formatting
- Crystal Reports - Creating Variables
- Crystal Reports - Creating Arrays
- Crystal Reports - Parameters
- Crystal Reports - Filters
- Crystal Reports - Prompt Panels
- Crystal Reports - Cascading Prompts
- Crystal Reports - Create Parameter Field
- Crystal Reports - Edit Parameter Field
- Crystal Subreports - Overview
- Crystal Reports - Data Export Overview
- Crystal Reports - Data Export to Excel
- Crystal Reports - Data Export to XML
- Crystal Reports - Data Export to HTML
- Crystal Reports - Data Export to CSV
- Crystal Reports Useful Resources
- Crystal Reports - Quick Guide
- Crystal Reports - Useful Resources
- Crystal Reports - Discussion
Crystal Reports - GUI Navigation
Crystal Reports for enterprise provides an interface that enables you to quickly and easily create, format, and publish effective reports.
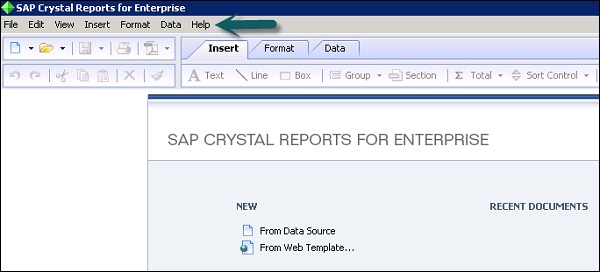
The menu bar provides full range of features available in Crystal Reports for Enterprise as shown in the following image.
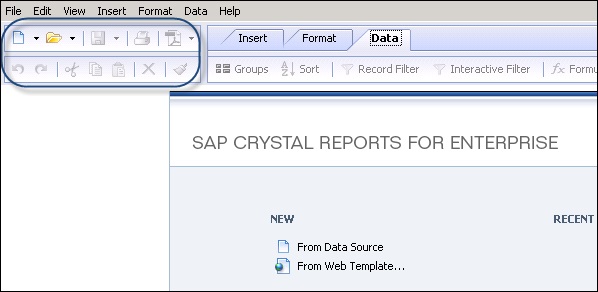
The standard toolbar as shown in the following image allows you to access common Report functions such as − Open an existing report, create a new report, save a report, print a report, cut, paste, export and undo.
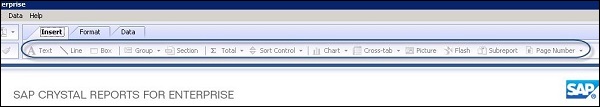
The Insert tab allows you to insert objects into you report, such as inserting a text, line, box, groups, sections, pictures, calculations and/or charts, as shown in the following image.
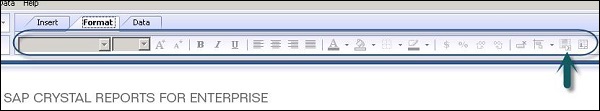
The Format tab as shown in the following image, allows you to use functions for formatting the selected field such as − changing the font size or font color, background color, alignment of text to center, left, right, etc.
It also allows you to apply conditional formatting, such as highlighting values above or below a specific threshold value in the report.
When you click on conditional formatting option at top right corner, the formatting box open. In this box, you define the condition under which you want conditional formatting to appear. In setting area, specify the formatting to appear when condition is met, like changing font style or color of text.
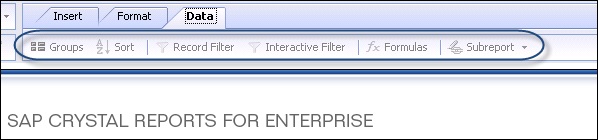
The Data tab as shown in the following figure, enables you to work with data-editing queries, creating groups and sorts, applying filters to limit data in the report and creating formulas to add custom calculations to reports.
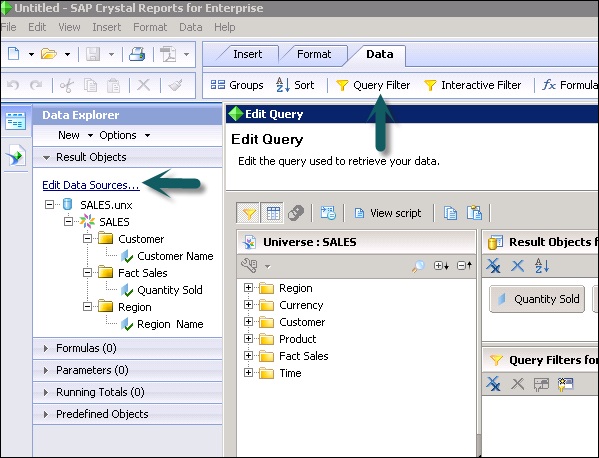
When you click on Query filter option or on Edit data sources, as shown in the following image, a query panel opens. In the Query panel, you can select objects that you want to see in the report. In the filter option, you can apply filters to restrict the data returned by the report.
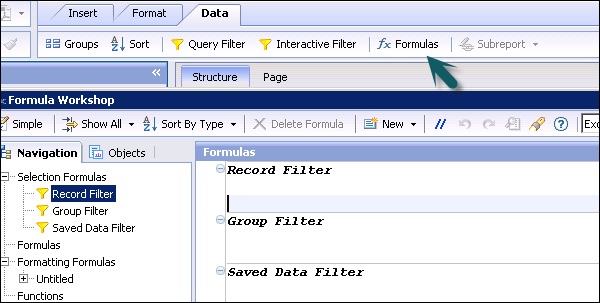
When you click on Formula button, as shown in the following image, the Formula workshop opens. This allow you to use custom calculations in the report. You can apply formulas by typing or by clicking on objects, functions and operators in the data explorer.
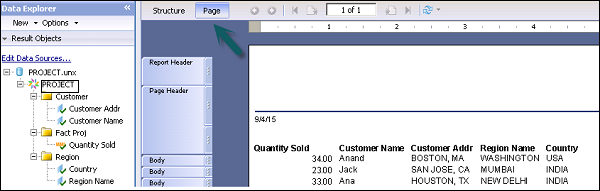
The main working area in Crystal Reports is known as Report Design Canvas and is divided into structure tab and page tab. Crystal Report is divided into five different parts by default and additional sections are added if you apply grouping to the report.
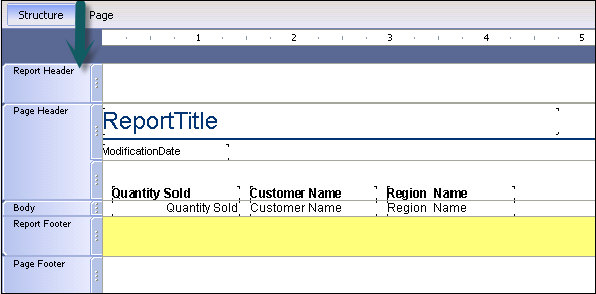
Using the Structure tab, as shown in the above image, you can create the overall structure by placing items in various sections of the report. You can also apply any required sorting, grouping, etc. Here, you work with placeholders for data and not data itself.
The Page tab, as shown in the following image, displays the report data on the basis of the structure you created in the structure tab. Here, you can evaluate formatting and layout of the report design for distribution.