- Crystal Reports - Home
- Crystal Reports - Overview
- Crystal Reports - GUI Navigation
- Crystal Reports - Options
- Crystal Reports - Page Layout
- Crystal Reports - Getting Help
- Crystal Reports - Design Environment
- Crystal Reports - Data Sources
- Crystal Reports - Queries
- Query Filters & Filter Conditions
- Crystal Reports - Time Based Filters
- Field Objects Controls & Modifications
- Crystal Reports - Sections
- Crystal Reports - Delete Sections
- Crystal Reports - Groups
- Crystal Reports - Group Options
- Crystal Reports - Templates
- Crystal Reports - Inserting Objects
- Crystal Reports - Charts
- Crystal Reports - Cross Tab Layout
- Crystal Reports - Defining Formulas
- Crystal Reports - Formula Workshop
- Creating & Modifying Formulas
- Crystal Reports - Apply Boolean Formulas
- Crystal Reports - If-Then-Else
- Crystal Reports - Applying Calculations
- Crystal Reports - Conditional Formatting
- Crystal Reports - Creating Variables
- Crystal Reports - Creating Arrays
- Crystal Reports - Parameters
- Crystal Reports - Filters
- Crystal Reports - Prompt Panels
- Crystal Reports - Cascading Prompts
- Crystal Reports - Create Parameter Field
- Crystal Reports - Edit Parameter Field
- Crystal Subreports - Overview
- Crystal Reports - Data Export Overview
- Crystal Reports - Data Export to Excel
- Crystal Reports - Data Export to XML
- Crystal Reports - Data Export to HTML
- Crystal Reports - Data Export to CSV
- Crystal Reports Useful Resources
- Crystal Reports - Quick Guide
- Crystal Reports - Useful Resources
- Crystal Reports - Discussion
Crystal Reports - Design Environment
SAP Crystal Report design environment provides you the area where you can design the structure of the report. It consists of multiple components −
Report Design Canvas
The Report Design Canvas is used to design the structure of your report. You can place various elements like charts, test elements, and data objects in the report.
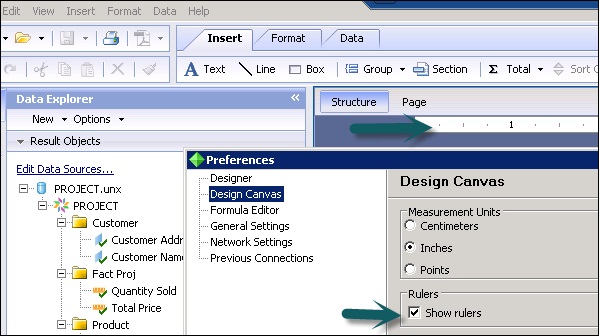
Show ruler option displays a ruler above the report canvas. You can change the unit of measurement by changing the measurement unit option on design canvas tab.
Structure mode and Page mode are available to define the layout of the report. Structure mode shows the structure of the report and Page mode is used for previewing the report.
Edit → Preference → Design Canvas
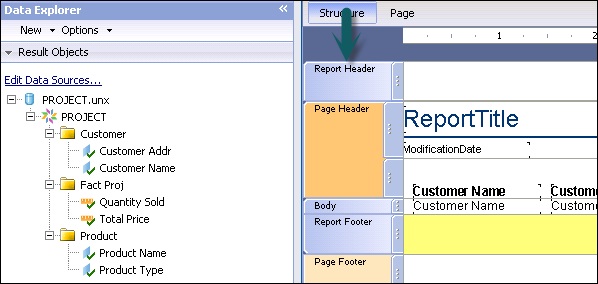
Structure Mode
Structure mode is used to provide an environment for designing the report. It provides a structure and instructions for creating the report. When you place an object in the report, it is shown in Structure mode. You can add/delete objects or apply complex formulas or you can also move the objects.
Each object in Structure mode is represented by a frame. Structure mode has multiple components that can be used to edit the report −
Report Header
It is used to add Report title at the top or any other information you want to place at the beginning of the report.
Page Header
This option is used to present information at the top of each page like document heading, chapter name, etc. Page header doesnt come in Report Header.
Body
This is used to show the body of the report. All report data comes in this section.
Report Footer
This is used to present information at the end of the report like totals, etc.
Page Footer
This is used to present page numbers or any other information you want at the end of each page.
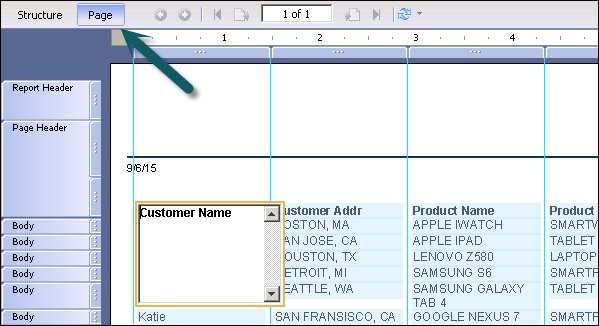
Page Mode
It represents the actual data in the report when the report is published or printed. It also allows you to change the formatting of the report with actual data and changes are immediately visible in the report.
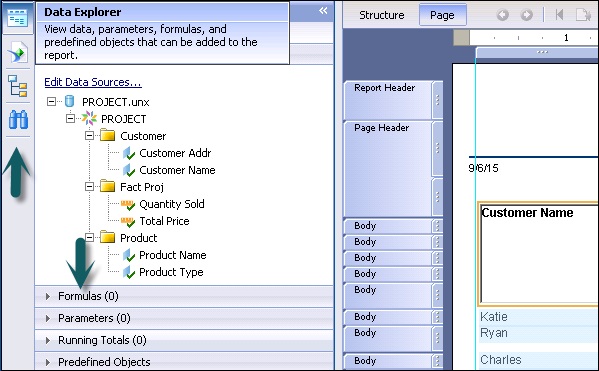
Data Explorer Side Bar
It is used to add/delete objects in the report. When you create a new report or open an existing report, this side panel opens itself.
All the objects that are added in the query panel are shown under data explorer and from here you can add objects to the report. This is further divided into the following components −
Result Objects
It shows all the objects that has been added to the report. You can also drag the objects to add in the report. Edit Data Sources option enables you to add new objects from the Universe or to choose a new Universe/Data Source from the repository.
Formula
This shows all the formula that has been created for the report. You can create new formula with a right click on Formula tab and → New → New Formula.
You can also drag formulas to the report.
Parameters
It shows all the parameters that has been created for the report. You can create new parameter group with a right click on Parameter → New → New Parameter.
Running Totals
It shows a list of all running totals that has been created for the report. You can create new running totals with a right click on tab → New Running Total.
Predefined Objects
It shows the predefined objects that can be added to a report. You can drag predefined objects to report canvas to add them to the report.
Outline
It is used to see the tree structure of the report. The first node in tree structure represents the report itself, the first level node represents the sections in the report, and each section containing objects are listed.
Group Tree
It is used to see tree view of all groups and subgroups in the report.
Find
It is used to search a specific value in the report. Type a word in the search box to find any value.
