- Crystal Reports - Home
- Crystal Reports - Overview
- Crystal Reports - GUI Navigation
- Crystal Reports - Options
- Crystal Reports - Page Layout
- Crystal Reports - Getting Help
- Crystal Reports - Design Environment
- Crystal Reports - Data Sources
- Crystal Reports - Queries
- Query Filters & Filter Conditions
- Crystal Reports - Time Based Filters
- Field Objects Controls & Modifications
- Crystal Reports - Sections
- Crystal Reports - Delete Sections
- Crystal Reports - Groups
- Crystal Reports - Group Options
- Crystal Reports - Templates
- Crystal Reports - Inserting Objects
- Crystal Reports - Charts
- Crystal Reports - Cross Tab Layout
- Crystal Reports - Defining Formulas
- Crystal Reports - Formula Workshop
- Creating & Modifying Formulas
- Crystal Reports - Apply Boolean Formulas
- Crystal Reports - If-Then-Else
- Crystal Reports - Applying Calculations
- Crystal Reports - Conditional Formatting
- Crystal Reports - Creating Variables
- Crystal Reports - Creating Arrays
- Crystal Reports - Parameters
- Crystal Reports - Filters
- Crystal Reports - Prompt Panels
- Crystal Reports - Cascading Prompts
- Crystal Reports - Create Parameter Field
- Crystal Reports - Edit Parameter Field
- Crystal Subreports - Overview
- Crystal Reports - Data Export Overview
- Crystal Reports - Data Export to Excel
- Crystal Reports - Data Export to XML
- Crystal Reports - Data Export to HTML
- Crystal Reports - Data Export to CSV
- Crystal Reports Useful Resources
- Crystal Reports - Quick Guide
- Crystal Reports - Useful Resources
- Crystal Reports - Discussion
Crystal Reports - Cross Tab Layout
Cross tab is used to display the data that is grouped or totaled in two directions. It shows data in a compact format, which makes it easier to understand and see the trend in the data. For example, if you want to see the quantity sold by the customer in a particular region, without cross tab, it shows the data in a spread-out form.
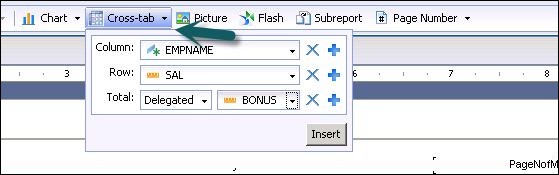
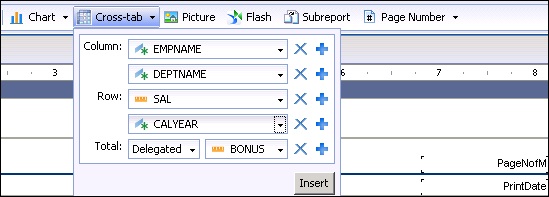
You can add multiple number of attributes in rows and columns by clicking on + sign. To delete an object click on X sign.
When you click on Insert, cross tab adds to the Structure of the report. If you click on the page tab, it will show Cross tab data in the report.
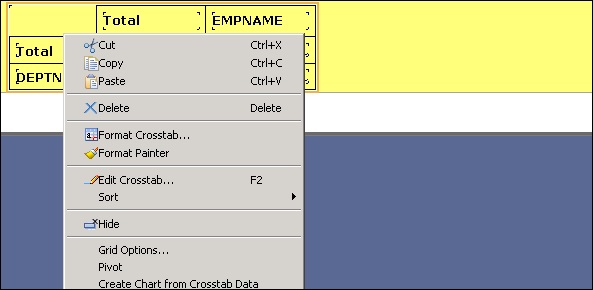
You can also edit the cells in cross tab. To edit Cross tab properties, right click on Cross tab and you can change the properties −
- Format Cross tab
- Edit Cross tab
- Sort
- Hide
- Grid Options
- Pivot
- Create chart from cross tab
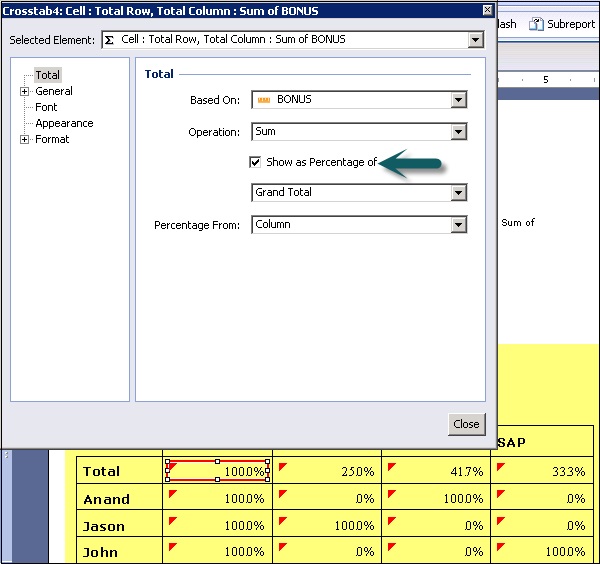
A Crosstab includes row totals, column totals and grand totals. To see values as percentage, right click on Total cell and go to Format Total → select show as percentage.
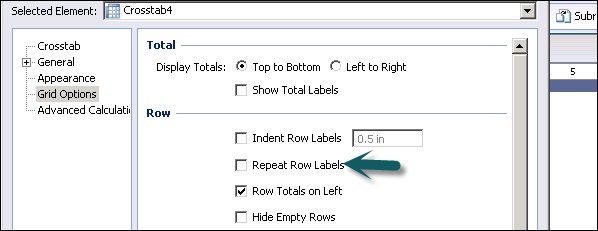
Grid options allow you to do formatting of cross tab rows like hiding empty rows, repeat row labels, hide row grand totals, etc. as shown in the following image.