
Article Categories
- All Categories
-
 Data Structure
-
 Networking
-
 RDBMS
RDBMS
-
 Operating System
-
 Java
Java
-
 MS Excel
-
 iOS
iOS
-
 HTML
HTML
-
 CSS
CSS
-
 Android
-
 Python
-
 C Programming
-
 C++
C++
-
 C#
C#
-
 MongoDB
-
 MySQL
MySQL
-
 Javascript
-
 PHP
PHP
-
 Economics & Finance
Selected Reading
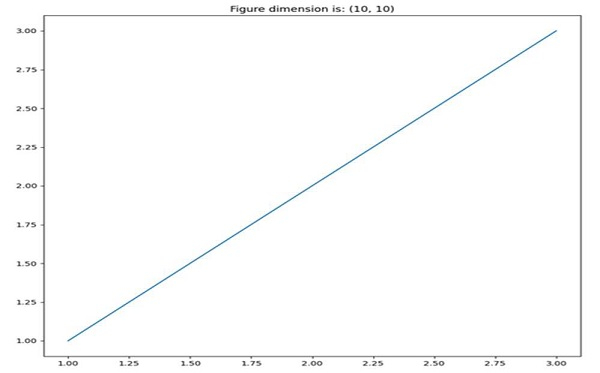
Change figure size and figure format in Matplotlib
Using the figsize attribute of figure(), we can change the figure size. To change the format of a figure, we can use the savefig method.
Steps
Store the figure size in the variable.
Create a new figure, or activate an existing figure, with given figure size.
Plot the line using x.
Set the image title with its size.
Save the figure using savefig() method.
Example
from matplotlib import pyplot as plt

figure_size = (10, 10)
plt.figure(figsize=figure_size)
x = [1, 2, 3]
plt.plot(x, x)
plt.title("Figure dimension is: {}".format(figure_size))
plt.savefig("imgae.png", format="png")
Output

Updated on: 2021-03-17T08:43:42+05:30
1K+ Views

Advertisements