 Data Structure
 Networking
 RDBMS
RDBMS Operating System
 Java
Java MS Excel
 iOS
iOS HTML
HTML CSS
CSS Android
 Python
 C Programming
 C++
C++ C#
C# MongoDB
 MySQL
MySQL Javascript
 PHP
PHP
- Selected Reading
- UPSC IAS Exams Notes
- Developer's Best Practices
- Questions and Answers
- Effective Resume Writing
- HR Interview Questions
- Computer Glossary
- Who is Who
How to modify existing figure instance in Matplotlib?
In this article, we will learn how to modify an existing figure instance in Matplotlib. We will see the complete step-wise process to modify the existing figure in matplotlib along with their complete examples in Python.
Matplotlib is a popular Python library used for creating various types of plots and visualizations. It provides a high-level interface to generate charts and graphs, as well as fine-grained control over every aspect of the figure. In Matplotlib, a figure instance represents the entire visualization, including one or more subplots, axes, titles, labels, and legends.
To work with a figure instance, we need to create one using the plt.figure() function. This creates a new figure instance and returns a reference to it. We can then add subplots, axes, titles, and other elements to the figure as needed.
Steps to Modify Existing Figure Instance in Matplotlib
Below are the complete steps to modify the existing figure instance in Matplotlib ?
Step 1: Import Required Modules
The first step to modify the existing figure instance in Matplotlb is to import its module. See the syntax below to import the required modules ?
import matplotlib.pyplot as plt
In the above code, we import the pyplot module of Matplotlib as a plt which is an alias to pyplot, which we will use throughout this article.
Step 2: Create a Figure Instance
The next step is to create a new figure instance. To do this, we can do this by using the plt.figure() function which is used to return a new Figure instance, which we can then modify.
fig = plt.figure()
The above code creates a new Figure instance and assigns it to the variable fig.
Step 3: Plot the Data
After creating a new Figure instance, now we will plot data onto it using one of the many plotting functions available in Matplotlib. For example, we can plot a simple line graph using the following code ?
x = [1, 2, 3, 4, 5]
y = [2, 4, 6, 8, 10]
plt.plot(x, y)
Step 4: Modifying the Figure Instance
The next step is to modify our created figure instance on which we have plotted some data onto our Figure instance. With this, we can now customize its appearance or add new elements. To modify a Figure instance in Matplotlib, there are multiple ways. Below are some common modifications ?
Change the Figure Size
We can change the size of the Figure instance using the fig.set_size_inches() function. This function takes a tuple of width and height in inches.
fig.set_size_inches(8, 6)
Change the Axes Limits
We can change the limits of the x and y axes using the plt.xlim() and plt.ylim() functions. These functions take two arguments each, which are the lower and upper limits of the axis.
plt.xlim(0, 6)
plt.ylim(0, 12)
Add a Title
We can add a title to the Figure instance using the plt.title() function. This function takes a string argument, which is the title of the figure.
plt.title("My Figure")
Step 5: Display the Figure
Once we have finished modifying the Figure instance, we need to show it using the plt.show() function.
plt.show()
Step 6: Modifying an Existing Figure Instance
To modify an existing Figure instance, we first need to obtain a reference to it. We can do this by assigning the Figure instance to a variable when we create it, or by using the plt.gcf() function to get a reference to the current Figure instance.
fig = plt.gcf()
This code gets a reference to the current Figure instance and assigns it to the variable fig.
Once we have a reference to the Figure instance, we can modify it using the same methods described in Step 4.
For example, we can change the size of the Figure instance as follows ?
fig.set_size_inches(10, 8)
This code changes the size of the Figure instance to 10 inches wide and 8 inches high.
We can also change the title of the Figure instance as follows ?
plt.title("My Modified Figure")
Step 7: Save the Figure
Once we have finished modifying the Figure instance, we may want to save it as an image file. We can do this using the plt.savefig() function. This function takes a filename as an argument and saves the Figure instance to that file.
Now, we have learned the complete steps to modify the existing figure instance in Matplotlib, let's see some examples that modify the existing figure instance using different approaches.
Example 1: Modifying an Existing Figure Instance
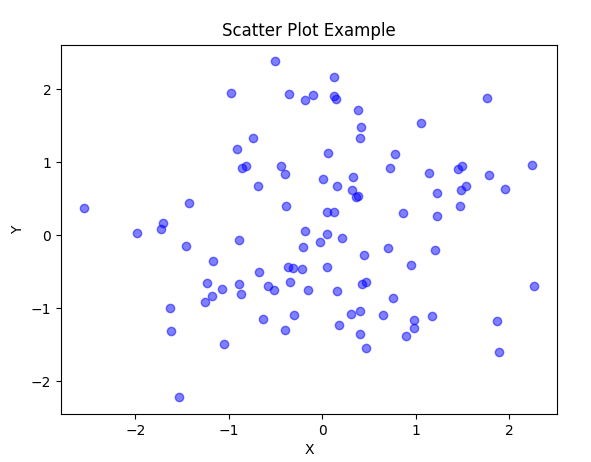
In the below example, we use the np.random.randn() to generate 100 random numbers for both x and y coordinates. Then, we create a scatter plot using plt.scatter() and customize the plot by setting the title, x-axis label, and y-axis label. Finally, we display the plot using plt.show(). The resulting plot will show a scatter plot with randomly distributed blue points.
import matplotlib.pyplot as plt
import numpy as np

# Generate random data
np.random.seed(0)
x = np.random.randn(100)
y = np.random.randn(100)

# Create a scatter plot
plt.scatter(x, y, color='blue', alpha=0.5)
plt.title("Scatter Plot Example")
plt.xlabel("X")
plt.ylabel("Y")

# Show the plot
plt.show()
Output

Example 2: Using Object-Oriented Interface
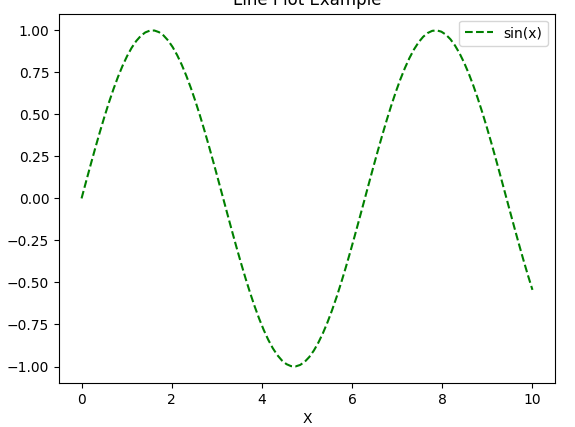
In the below example, we create a Figure object and an Axes object using plt.subplots(). Then, we use the Axes object ax to plot the data using ax.plot(). We customize the line color, linestyle, and add a label for the legend. The Axes object is used to set the title, x-axis label, y-axis label, and add a legend using ax.set_title(), ax.set_xlabel(), ax.set_ylabel(), and ax.legend() respectively. Finally, we display the plot using plt.show(). The resulting plot will show a line plot of the sine function with a red dashed line.
import matplotlib.pyplot as plt
import numpy as np

# Generate data
x = np.linspace(0, 10, 100)
y = np.sin(x)

# Create a Figure and Axes objects
fig, ax = plt.subplots()

# Plot the data using the Axes object
ax.plot(x, y, color='green', linestyle='--', label='sin(x)')
ax.set_title('Line Plot Example')
ax.set_xlabel('X')
ax.set_ylabel('Y')
ax.legend()

# Show the plot
plt.show()
Output

Conclusion
Modifying an existing figure instance in Matplotlib can be achieved by following the simple steps discussed. In this article, we learned how to modify the existing figure instance in Matplotlib. We first import the required modules, create a new Figure instance, plot some data onto it, and then modify it to customize its appearance or add new elements. Matplotlib provides different ways to modify a Figure instance, such as changing the size, limits of the axes, adding a title, and more. Using these techniques, we can create visually appealing and informative plots in Python.

