- Matplotlib - Home
- Matplotlib - Introduction
- Matplotlib - Vs Seaborn
- Matplotlib - Environment Setup
- Matplotlib - Anaconda distribution
- Matplotlib - Jupyter Notebook
- Matplotlib - Pyplot API
- Matplotlib - Simple Plot
- Matplotlib - Saving Figures
- Matplotlib - Markers
- Matplotlib - Figures
- Matplotlib - Styles
- Matplotlib - Legends
- Matplotlib - Colors
- Matplotlib - Colormaps
- Matplotlib - Colormap Normalization
- Matplotlib - Choosing Colormaps
- Matplotlib - Colorbars
- Matplotlib - Working With Text
- Matplotlib - Text properties
- Matplotlib - Subplot Titles
- Matplotlib - Images
- Matplotlib - Image Masking
- Matplotlib - Annotations
- Matplotlib - Arrows
- Matplotlib - Fonts
- Matplotlib - Font Indexing
- Matplotlib - Font Properties
- Matplotlib - Scales
- Matplotlib - LaTeX
- Matplotlib - LaTeX Text Formatting in Annotations
- Matplotlib - PostScript
- Matplotlib - Mathematical Expressions
- Matplotlib - Animations
- Matplotlib - Celluloid Library
- Matplotlib - Blitting
- Matplotlib - Toolkits
- Matplotlib - Artists
- Matplotlib - Styling with Cycler
- Matplotlib - Paths
- Matplotlib - Path Effects
- Matplotlib - Transforms
- Matplotlib - Ticks and Tick Labels
- Matplotlib - Radian Ticks
- Matplotlib - Dateticks
- Matplotlib - Tick Formatters
- Matplotlib - Tick Locators
- Matplotlib - Basic Units
- Matplotlib - Autoscaling
- Matplotlib - Reverse Axes
- Matplotlib - Logarithmic Axes
- Matplotlib - Symlog
- Matplotlib - Unit Handling
- Matplotlib - Ellipse with Units
- Matplotlib - Spines
- Matplotlib - Axis Ranges
- Matplotlib - Axis Scales
- Matplotlib - Axis Ticks
- Matplotlib - Formatting Axes
- Matplotlib - Axes Class
- Matplotlib - Twin Axes
- Matplotlib - Figure Class
- Matplotlib - Multiplots
- Matplotlib - Grids
- Matplotlib - Object-oriented Interface
- Matplotlib - PyLab module
- Matplotlib - Subplots() Function
- Matplotlib - Subplot2grid() Function
- Matplotlib - Anchored Artists
- Matplotlib - Manual Contour
- Matplotlib - Coords Report
- Matplotlib - AGG filter
- Matplotlib - Ribbon Box
- Matplotlib - Fill Spiral
- Matplotlib - Findobj Method
- Matplotlib - Hyperlinks
- Matplotlib - Image Thumbnail
- Matplotlib - Plotting with Keywords
- Matplotlib - Create Logo
- Matplotlib - Multipage PDF
- Matplotlib - Multiprocessing
- Matplotlib - Print Stdout
- Matplotlib - Compound Path
- Matplotlib - Sankey Class
- Matplotlib - MRI with EEG
- Matplotlib - Stylesheets
- Matplotlib - Background Colors
- Matplotlib - Basemap
Matplotlib Events
- Matplotlib - Event Handling
- Matplotlib - Close Event
- Matplotlib - Mouse Move
- Matplotlib - Click Events
- Matplotlib - Scroll Event
- Matplotlib - Keypress Event
- Matplotlib - Pick Event
- Matplotlib - Looking Glass
- Matplotlib - Path Editor
- Matplotlib - Poly Editor
- Matplotlib - Timers
- Matplotlib - Viewlims
- Matplotlib - Zoom Window
Matplotlib Widgets
- Matplotlib - Cursor Widget
- Matplotlib - Annotated Cursor
- Matplotlib - Button Widget
- Matplotlib - Check Buttons
- Matplotlib - Lasso Selector
- Matplotlib - Menu Widget
- Matplotlib - Mouse Cursor
- Matplotlib - Multicursor
- Matplotlib - Polygon Selector
- Matplotlib - Radio Buttons
- Matplotlib - RangeSlider
- Matplotlib - Rectangle Selector
- Matplotlib - Ellipse Selector
- Matplotlib - Slider Widget
- Matplotlib - Span Selector
- Matplotlib - Textbox
Matplotlib Plotting
- Matplotlib - Line Plots
- Matplotlib - Area Plots
- Matplotlib - Bar Graphs
- Matplotlib - Histogram
- Matplotlib - Pie Chart
- Matplotlib - Scatter Plot
- Matplotlib - Box Plot
- Matplotlib - Arrow Demo
- Matplotlib - Fancy Boxes
- Matplotlib - Zorder Demo
- Matplotlib - Hatch Demo
- Matplotlib - Mmh Donuts
- Matplotlib - Ellipse Demo
- Matplotlib - Bezier Curve
- Matplotlib - Bubble Plots
- Matplotlib - Stacked Plots
- Matplotlib - Table Charts
- Matplotlib - Polar Charts
- Matplotlib - Hexagonal bin Plots
- Matplotlib - Violin Plot
- Matplotlib - Event Plot
- Matplotlib - Heatmap
- Matplotlib - Stairs Plots
- Matplotlib - Errorbar
- Matplotlib - Hinton Diagram
- Matplotlib - Contour Plot
- Matplotlib - Wireframe Plots
- Matplotlib - Surface Plots
- Matplotlib - Triangulations
- Matplotlib - Stream plot
- Matplotlib - Ishikawa Diagram
- Matplotlib - 3D Plotting
- Matplotlib - 3D Lines
- Matplotlib - 3D Scatter Plots
- Matplotlib - 3D Contour Plot
- Matplotlib - 3D Bar Plots
- Matplotlib - 3D Wireframe Plot
- Matplotlib - 3D Surface Plot
- Matplotlib - 3D Vignettes
- Matplotlib - 3D Volumes
- Matplotlib - 3D Voxels
- Matplotlib - Time Plots and Signals
- Matplotlib - Filled Plots
- Matplotlib - Step Plots
- Matplotlib - XKCD Style
- Matplotlib - Quiver Plot
- Matplotlib - Stem Plots
- Matplotlib - Visualizing Vectors
- Matplotlib - Audio Visualization
- Matplotlib - Audio Processing
Matplotlib Useful Resources
- Matplotlib - Quick Guide
- Matplotlib - Cheatsheet
- Matplotlib - Useful Resources
- Matplotlib - Discussion
Matplotlib - Fonts
Fonts play a crucial role in customizing text elements within plots. We can control font styles, sizes, families and other properties to enhance the appearance and readability of text in our visualizations.
In Matplotlib library Fonts refer to the typefaces used for rendering text in plots and visualizations. Fonts play a significant role in customizing the appearance of text elements such as labels, titles, annotations and legends within plots.
Key Aspects of Fonts in Matplotlib library
Font Family − Refers to the style or category of the font. Common font families include serif, sans-serif, monospace etc. Each family has its own visual characteristics.
Font Style − Determines the appearance of text such as normal, italic or oblique.
Font Weight − Specifies the thickness or boldness of the font ranging from normal to various levels of boldness.
Controlling Fonts in Matplotlib
Setting Font Properties − We can control font properties for text elements in plots using parameters such as 'fontsize', 'fontstyle', 'fontweight' and 'fontfamily' in the functions such as 'plt.xlabel()', 'plt.title()' etc.
plt.xlabel('X-axis Label',
   fontsize=12, fontstyle='italic',
	fontweight='bold', fontfamily='serif')
Global Font Configuration − Adjusting font properties globally for the entire plot using 'plt.rcParams' allows us to set default font settings for consistency.
plt.rcParams['font.family'] = 'sans-serif'
plt.rcParams['font.size'] = 12
Importance of Fonts in Visualization
Readability − The choice of fonts significantly impacts the readability of text elements in plots. Selecting appropriate fonts improves the clarity of visualized information.
Aesthetics − Fonts contribute to the overall aesthetics of the plot by affecting its visual appeal and presentation.
Emphasis and Style − Different fonts convey various tones and styles allowing users to emphasize specific elements or create a particular visual atmosphere.
Setting Font Properties Globally
We can configure font properties globally for the entire plot using plt.rcParams.
plt.rcParams['font.family'] = 'sans-serif'
plt.rcParams['font.size'] = 12
In the upcoming chapters lets go through the each parameter of the fonts in detail.
Common Font-related Functions in Matplotlib
The following are the common font related functions in matplotlib library.
plt.rcParam − plt.rcParams in Matplotlib is a dictionary-like object that allows you to globally configure various settings that affect the appearance and behavior of plots and figures. It serves as a central configuration system for Matplotlib, providing a convenient way to set default parameters for different elements in visualizations.
Functions to set font properties − We can set the font properties for axis labels and titles using the plt.xlabel(), plt.ylabel() and, plt.title() functions.
Setting font properties to annotations − Similarly, we can set font properties for annotations and text elements using plt.text() and, plt.annotate() functions
Example - Listing All the Available Fonts
To get a list of all the fonts currently available for matplotlib we can use the font_manager.findSystemFonts() method as shown below −
from matplotlib import font_manager
print("List of all fonts currently available in the matplotlib:")
print(*font_manager.findSystemFonts(fontpaths=None, fontext='ttf'), sep="")
Output
The above program generates the following output −
List of all fonts currently available in the matplotlib:
C:\WINDOWS\Fonts\PERBI___.TTFC:\WINDOWS\Fonts\ARIALUNI.TTFC:\Windows\Fonts\BRLNSR.TTFC:\Windows\Fonts\calibri.ttfC:\WINDOWS\Fonts\BOD_PSTC.TTFC:\WINDOWS\Fonts\WINGDNG3.TTFC:\Windows\Fonts\segoeuisl.ttfC:\Windows\Fonts\HATTEN.TTFC:\WINDOWS\Fonts\segoepr.ttfC:\Windows\Fonts\TCCM____.TTFC:\Windows\Fonts\BOOKOS.TTFC:\Windows\Fonts\BOD_B.TTFC:\WINDOWS\Fonts\corbelli.ttfC:\WINDOWS\Fonts\TEMPSITC.TTFC:\WINDOWS\Fonts\arial.ttfC:\WINDOWS\Fonts\cour.ttfC:\Windows\Fonts\OpenSans-Semibold.ttfC:\WINDOWS\Fonts\palai.ttfC:\Windows\Fonts\ebrimabd.ttfC:\Windows\Fonts\taileb.ttfC:\Windows\Fonts\SCHLBKI.TTFC:\Windows\Fonts\AGENCYR.TTFC:\Windows\Fonts\tahoma.ttfC:\Windows\Fonts\ARLRDBD.TTFC:\WINDOWS\Fonts\corbeli.ttfC:\WINDOWS\Fonts\arialbd.ttfC:\WINDOWS\Fonts\LTYPEBO.TTFC:\WINDOWS\Fonts\LTYPEB.TTFC:\WINDOWS\Fonts\BELLI.TTFC:\WINDOWS\Fonts\YuGothR.ttcC:\WINDOWS\Fonts\OpenSans-Semibold.ttfC:\Windows\Fonts\trebucbd.ttfC:\WINDOWS\Fonts\OCRAEXT.TTFC:\WINDOWS\Fonts\JUICE___.TTFC:\WINDOWS\Fonts\comic.ttfC:\Windows\Fonts\VIVALDII.TTFC:\Windows\Fonts\Candarali.ttfC:\WINDOWS\Fonts\comici.ttfC:\WINDOWS\Fonts\RAVIE.TTFC:\WINDOWS\Fonts\LeelUIsl.ttfC:\Windows\Fonts\ARIALNB.TTFC:\WINDOWS\Fonts\LSANSDI.TTFC:\Windows\Fonts\seguibl.ttfC:\WINDOWS\Fonts\himalaya.ttfC:\WINDOWS\Fonts\TCBI___
..................................................................................................................................................................................................................................................................................................................................................................................................................................................................................................................................................................
TTFC:\Windows\Fonts\BOD_BLAR.TTFC:\WINDOWS\Fonts\ebrima.ttfC:\Windows\Fonts\LTYPEB.TTFC:\WINDOWS\Fonts\FRABKIT.TTFC:\WINDOWS\Fonts\REFSAN.TTFC:\WINDOWS\Fonts\gadugi.ttfC:\Windows\Fonts\times.ttfC:\WINDOWS\Fonts\MTCORSVA.TTFC:\WINDOWS\Fonts\ERASDEMI.TTFC:\Windows\Fonts\himalaya.ttfC:\WINDOWS\Fonts\georgiai.ttf
Example - Listing all the font families (or Name of Fonts)
Here by using the below code we will get the list of the font family i.e. Name of fonts.
from matplotlib import font_manager
print("List of all fonts currently available in the matplotlib:")
print(*font_manager.findSystemFonts(fontpaths=None, fontext='ttf'), sep="")
Output
The above program generates the following output −
List of all fonts currently available in the matplotlib:
cmsy10
STIXGeneral
STIXSizeThreeSym
DejaVu Sans Mono
STIXGeneral
STIXSizeOneSym
.......................................................................
ITC Bookman
Computer Modern
Times
Palatino
New Century Schoolbook
Controlling Font Properties
Font Size ('fontsize')
Set the size of text elements using the fontsize parameter in functions like plt.xlabel(), plt.ylabel(), plt.title() etc.
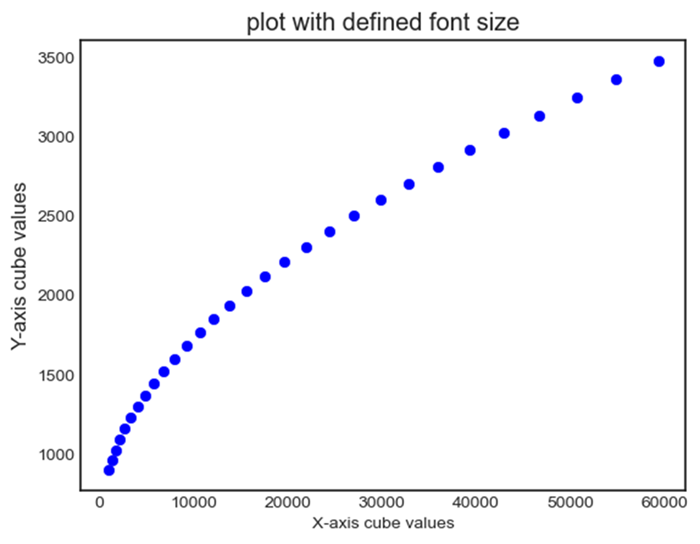
Example - Setting Font Size
In this example we are setting the size of the text by passing the fontsize parameter to the plt.xlabel(), plt.ylabel() and plt.title() functions.
import matplotlib.pyplot as plt
# Creating a data
x = [i for i in range(10,40)]
y = [i for i in range(30,60)]

# Creating a plot
plt.scatter(x,y,color = 'blue')
plt.xlabel('X-axis cube values', fontsize = 10)
plt.ylabel('Y-axis cube values', fontsize = 12)
plt.title('plot with defined font size')
plt.show()
Output
Font Style ('fontstyle')
We can choose the font styles such as 'normal', 'italic', or 'oblique' for the font that we want to use on the created plot.
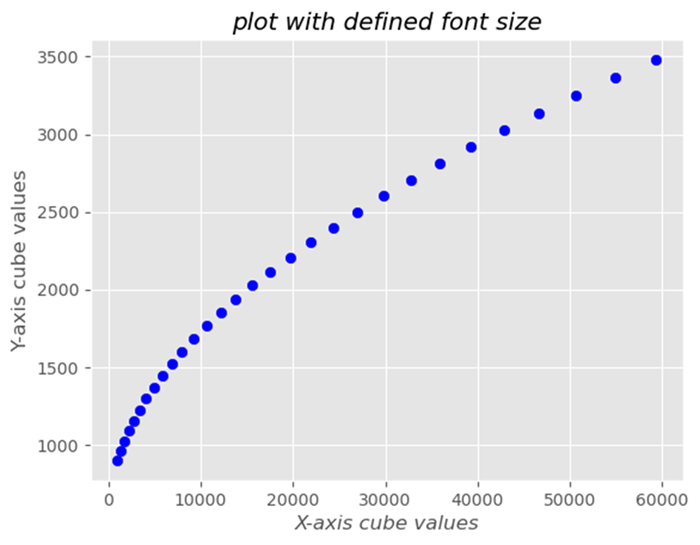
Example - Setting Font Style
Here we are setting the font style of the fonts that we are displaying on the plot by passing fontstyle parameter as 'normal'', 'italic', or 'oblique' to the plt.xlabel(), plt.ylabel() and plt.title().
import matplotlib.pyplot as plt
# Creating a data
x = [i for i in range(10,40)]
y = [i for i in range(30,60)]

# Creating a plot
plt.scatter(x,y,color = 'blue')
plt.xlabel('X-axis cube values', fontsize = 10)
plt.ylabel('Y-axis cube values', fontsize = 12)
plt.title('plot with defined font size')
plt.show()
Output
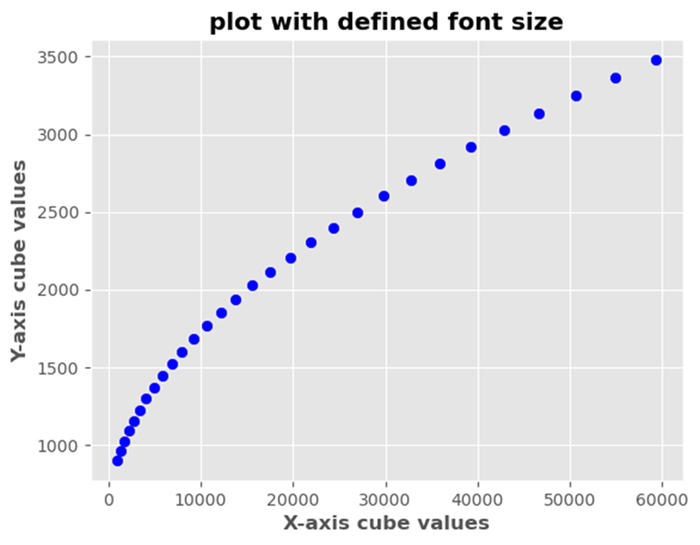
Font Weight ('fontweight')
Adjust the thickness of the font using weights like 'normal', 'bold', or numerical values such as 400, 700, etc.
Example - Setting Font Weight
import matplotlib.pyplot as plt
# Creating a data
x = [i for i in range(10,40)]
y = [i for i in range(30,60)]

# Creating a plot
plt.scatter(x,y,color = 'blue')
plt.xlabel('X-axis cube values', fontweight='bold')
plt.ylabel('Y-axis cube values', fontweight='bold')
plt.title('plot with defined font size',fontweight='bold')
plt.show()
Output
Changing Font Family
We can modify the font family for various text elements in Matplotlib library. Some available font families are mentioned below.
'serif' − Serif fonts such as Times New Roman
'sans-serif' − Sans-serif fonts such as Arial
'monospace' − Monospaced fonts such as Courier New
Change size of the fonts
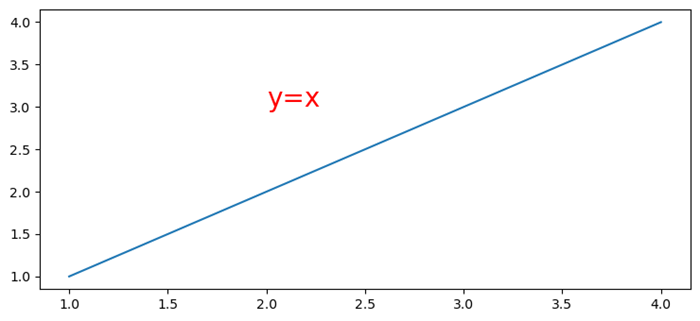
We can change the size of the font by using the plt.text() function.
Example - Seting Font Size
import matplotlib.pyplot as plt
plt.plot([1, 2, 4], [1, 2, 4])
plt.text(2, 3, "y=x", color='red', fontsize=20)

# Increase fontsize by increasing value.
plt.show()
Output
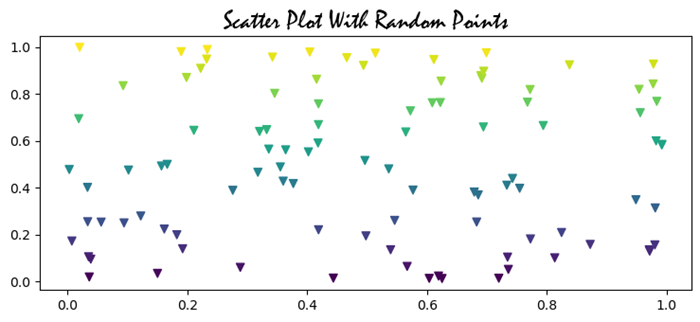
Embed fonts in PDFs produced by Matplotlib
To embed fonts in PDFs produced by Matplotlib we can use rc.Params['pdf.fonttype']=42.
Example - Embedding Fonts
import numpy as np
from matplotlib import pyplot as plt, font_manager as fm

plt.rcParams["figure.figsize"] = [7.50, 3.50]
plt.rcParams["figure.autolayout"] = True
plt.rcParams['pdf.fonttype'] = 42

fig, ax = plt.subplots()
x = np.random.rand(100)
y = np.random.rand(100)

ax.scatter(x, y, c=y, marker="v")

fprop = fm.FontProperties(fname='C:\Windows\Fonts\MISTRAL.TTF')

ax.set_title('Scatter Plot With Random Points',
   fontproperties=fprop, size=20, fontweight="bold")

plt.savefig("demo.pdf")
Output
When we execute the code it will save the following plot in the project directory with the file name as "demo.pdf".
Setting Font Properties Globally
Setting font properties globally in Matplotlib library involves configuring default font settings for the entire plot using plt.rcParams method. This is useful when we want to apply consistent font styles, sizes or families to all text elements in our visualizations without specifying them individually for each component.
It's important to note that we can tailor these settings based on our preferences and the visual style we want to achieve in our plots. We can adjust the values to match our desired font styles, sizes and families for a consistent and aesthetically pleasing appearance across our visualizations.
The following are the different settings that we can make by using the plt.rcParams method.
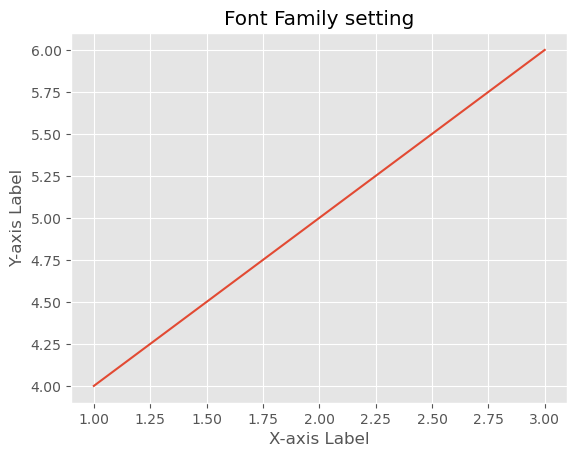
plt.rcParams['font.family'] = font_name
This sets the default font family for text elements such as 'sans-serif'. We can replace font_name with the available font families such as 'serif', 'monospace' or specific font names.
Example - Setting Font Family
In this example we are trying to set the font family to 'sans-serif' by using the plt.rcParams['font.family'].
import matplotlib.pyplot as plt
# Set font properties globally
plt.rcParams['font.family'] = 'sans-serif'

# Create a plot
plt.plot([1, 2, 3], [4, 5, 6])
plt.xlabel('X-axis Label')
plt.ylabel('Y-axis Label')
plt.title('Font Family setting')
plt.show()
Output
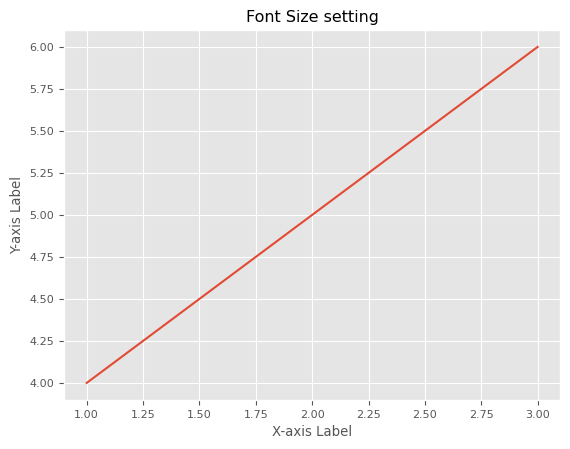
plt.rcParams['font.size'] = font_size
We can specify the default font size for text elements in numerical values as per the requirement. This ensures that all text elements use this font size unless overridden for specific components.
Example - Setting Font Size
In this example we are specifying the fontsize as 8 points to the plt.rcParams['font.size'] to display font size globally all over the plot.
import matplotlib.pyplot as plt
# Set font properties globally
plt.rcParams['font.size'] = 8

# Create a plot
plt.plot([1, 2, 3], [4, 5, 6])
plt.xlabel('X-axis Label')
plt.ylabel('Y-axis Label')
plt.title('Font Size setting')
plt.show()
Output
plt.rcParams['font.style'] = 'fontstyle'
We can define the font style such as italic etc., as per our interest to the plt.rcParams['font.style']. This applies the defined appearance to text elements throughout the plot.
Example - Setting Font Style
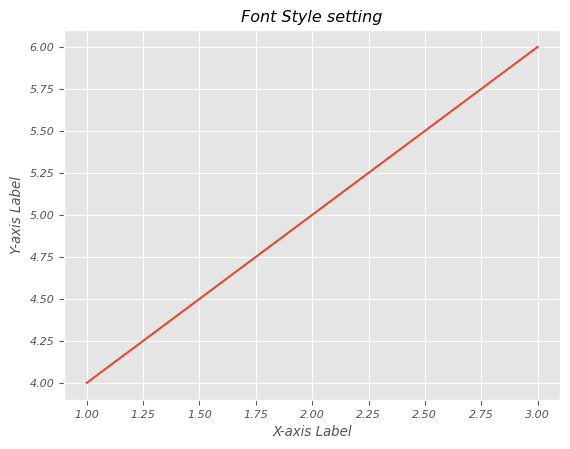
In this example we are specifying the font style as italic to the plt.rcParams['font.style'].
import matplotlib.pyplot as plt
# Set font properties globally
plt.rcParams['font.style'] = 'italic'

# Create a plot
plt.plot([1, 2, 3], [4, 5, 6])
plt.xlabel('X-axis Label')
plt.ylabel('Y-axis Label')
plt.title('Font Style setting')
plt.show()
Output
plt.rcParams['font.weight'] = font_weight
By using this we can set the font weight such as 'bold' etc. This makes the characters in text elements appear in the defined style as per the user requirement.
Example - Setting Font Weight
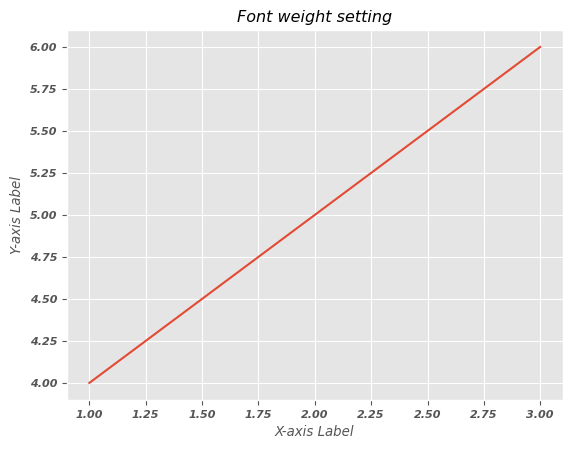
Here in this example we are specifying the font weight as bold to the plt.rcParams['font.weight'].
import matplotlib.pyplot as plt
# Set font properties globally
plt.rcParams['font.weight'] = 'bold'

# Create a plot
plt.plot([1, 2, 3], [4, 5, 6])
plt.xlabel('X-axis Label')
plt.ylabel('Y-axis Label')
plt.title('Font weight setting')
plt.show()
Output
Note − By setting these parameters globally using plt.rcParams we can ensure that these default font properties are applied to all text elements in our Matplotlib plots. When we create labels, titles or other text components they will inherit these global settings unless we specify different properties locally.
Change the font properties of a Matplotlib colorbar label
In this example we are changing the font properties of a matplotlib colorbar label.
Example - Changing Font Properties
import numpy as np
import matplotlib.pyplot as plt
plt.rcParams["figure.figsize"] = [7.50, 3.50]
plt.rcParams["figure.autolayout"] = True
x, y = np.mgrid[-1:1:100j, -1:1:100j]
z = (x + y) * np.exp(-5.0 * (x ** 2 + y ** 2))
plt.imshow(z, extent=[-1, 1, -1, 1])
cb = plt.colorbar(label='my color bar label')
plt.show()
Output

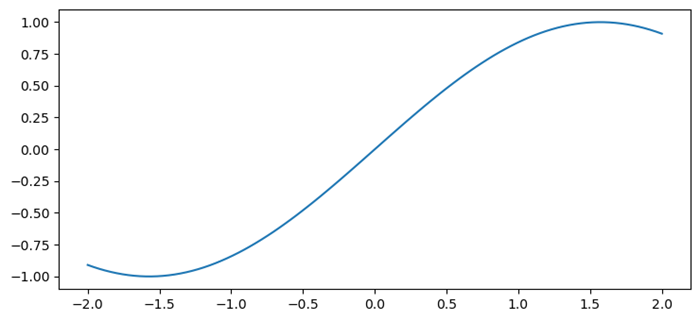
Setting the size of the plotting canvas
Here in this example we are setting the size of the plotting canvas in matplotlib.
Example - Setting Size of Canvas
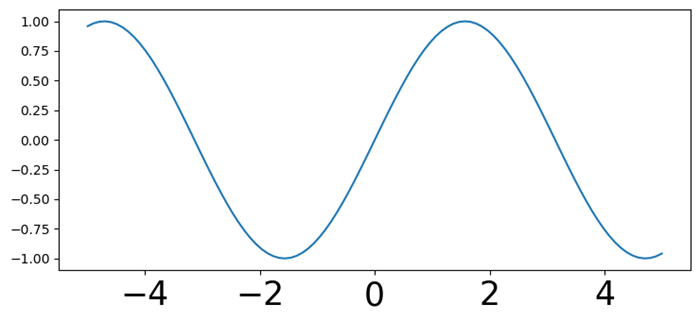
import numpy as np
from matplotlib import pyplot as plt
plt.rcParams["figure.figsize"] = [7.50, 3.50]
plt.rcParams["figure.autolayout"] = True
x = np.linspace(-2, 2, 100)
y = np.sin(x)
plt.plot(x, y)
plt.show()
Output
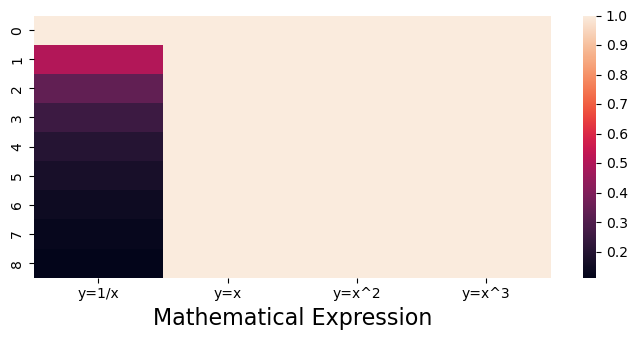
Auto adjust font size in Seaborn heatmap using Matplotlib
Here we are auto adjusting the font size in seaborn heatmap by using the Matplotlib library.
Example - Auto Adjust Font Size
import numpy as np
import seaborn as sns
from matplotlib import pyplot as plt
import pandas as pd
plt.rcParams["figure.figsize"] = [7.00, 3.50]
plt.rcParams["figure.autolayout"] = True
d = {
   'y=1/x': [1 / i for i in range(1, 10)],
   'y=x': [i for i in range(1, 10)],
   'y=x^2': [i * i for i in range(1, 10)],
   'y=x^3': [i * i * i for i in range(1, 10)]
}
df = pd.DataFrame(d)
ax = sns.heatmap(df, vmax=1)
plt.xlabel('Mathematical Expression', fontsize=16)
plt.show()
Output
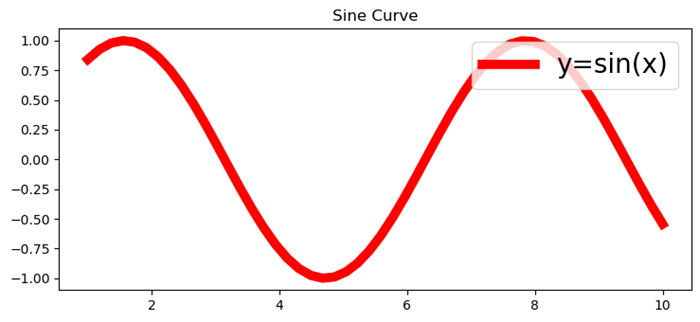
Set the font size of Matplotlib axis Legend
In this example we are setting the font size of matplotlib axis legend
Example - Setting Font Size of Axis Legend
import numpy as np
from matplotlib import pyplot as plt
import matplotlib
plt.rcParams["figure.figsize"] = [7.50, 3.50]
plt.rcParams["figure.autolayout"] = True
x = np.linspace(1, 10, 50)
y = np.sin(x)
plt.plot(x, y, c="red", lw=7, label="y=sin(x)")
plt.title("Sine Curve")
matplotlib.rcParams['legend.fontsize'] = 20
plt.legend(loc=1)
plt.show()
Output
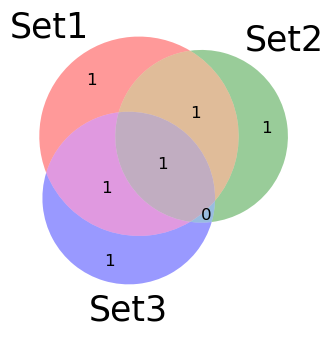
Modify the font size in Matplotlib-venn
To work with the Matplotlib-venn, first we have to install the package by using the below code. If previously installed we can import directly.
pip install matplotlib-venn
Example - Setting Font Size
In this example we are modifying the font size in Matplotlib-venn by using the set_fontsize() method.
from matplotlib import pyplot as plt
from matplotlib_venn import venn3
plt.rcParams["figure.figsize"] = [7.50, 3.50]
plt.rcParams["figure.autolayout"] = True
set1 = {'a', 'b', 'c', 'd'}
set2 = {'a', 'b', 'e'}
set3 = {'a', 'd', 'f'}
out = venn3([set1, set2, set3], ('Set1', 'Set2', 'Set3'))
for text in out.set_labels:
   text.set_fontsize(25)
for text in out.subset_labels:
   text.set_fontsize(12)
plt.show()
Output
Change xticks font size
To change the font size of xticks in a matplotlib plot we can use the fontsize parameter.
Example - Chanding xticks Font Size
from matplotlib import pyplot as plt
import numpy as np

# Set the figure size
plt.rcParams["figure.figsize"] = [7.50, 3.50]
plt.rcParams["figure.autolayout"] = True

# x and y data points
x = np.linspace(-5, 5, 100)
y = np.sin(x)
plt.plot(x, y)

# Set the font size of xticks
plt.xticks(fontsize=25)

# Display the plot
plt.show()
Output