 Data Structure
 Networking
 RDBMS
RDBMS Operating System
 Java
Java MS Excel
 iOS
iOS HTML
HTML CSS
CSS Android
 Python
 C Programming
 C++
C++ C#
C# MongoDB
 MySQL
MySQL Javascript
 PHP
PHP
- Selected Reading
- UPSC IAS Exams Notes
- Developer's Best Practices
- Questions and Answers
- Effective Resume Writing
- HR Interview Questions
- Computer Glossary
- Who is Who
How to create an empty Figure with Matplotlib in Python?
Matplotlib is a powerful Python library used for data visualization and creating 2D plots. It provides various tools for creating static, animated, and interactive plots, including line plots, scatter plots, bar plots, histograms, etc. Matplotlib is highly customizable, allowing users to adjust colors, fonts, and other visual elements to create high-quality visualizations.
It is widely used in data science, engineering, and scientific research and is considered one of Python's most popular data visualization libraries. Matplotlib is open-source and actively developed, with a large community of users and contributors who provide support and maintain the library.
Creating an Empty Figure Using Inline Backend Matplotplib in Jupyter Notebook
Matplotlib inline backend is a feature of the Matplotlib library that allows users to display plots directly in the Jupyter Notebook or JupyterLab interface rather than in a separate window or file. When the inline backend is enabled, the output of Matplotlib commands is rendered as static images or interactive plots directly in the notebook cells, making it easier to explore and analyze data in an interactive environment.
To enable the inline backend, users can include the magic command %matplotlib inline at the beginning of a Jupyter Notebook or JupyterLab session. This is optional as inline backend is by default, used in Jupyter notebook.
Syntax
To create an empty Figure in Matplotlib, you need to follow the following syntax ?
import matplotlib.pyplot as plt
plt.figure(figsize=(width, height))
We have used the Matplotlib pyplot. figure() method to create an empty figure. Generally, we pass a particular graph or plot in this method as the first parameter but if we omit that, we can generate an empty figure. Also, note that the figsize argument is optional here. It specifies the height and width of the figure to be created.
Example 1
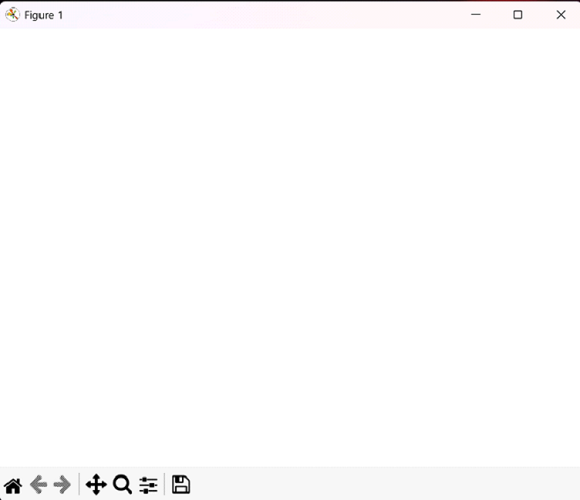
To create an empty figure using matplotlib, we have imported matplotlib.pyplot module with an alias plt. A plt.figure() function can be used to draw any plots or figures. But if we don't pass any arguments to this function, it will create an empty figure. Finally, we have displayed the figure using the plt.show() function.
import matplotlib.pyplot as plt
fig = plt.figure()
plt.show()
Output

Example 2
In this example, we first imported the matplotlib.pyplot module as plt. Then, we created a figure object using the figure() function. Unlike the previous example, the figure() function here takes an argument figsize which is a tuple of integers. This argument specifies the width and height of the figure in inches. The default value of figsize is (6.4, 4.8).
import matplotlib.pyplot as plt
fig = plt.figure(figsize=(3, 3))
plt.show()
Output

We learned how to create an empty figure with Matplotlib in Python using the default inline backend of Jupyter notebook. This learning can be very much helpful for the ones who are beginners in creating figures and plots using matplotlib or any other visualization library in Python.
Creating an Empty Figure Using Ipympl Backend Matplotplib in Jupyter Notebook
Matplotlib ipympl backend is a feature of the Matplotlib library that provides interactive plots within Jupyter Notebook or JupyterLab using the ipympl library. With the ipympl backend, users can create interactive plots that can be panned, zoomed, and scaled using the mouse or keyboard, making exploring and analysing data in an interactive environment easier. The ipympl backend supports many plot types, including line plots, scatter plots, bar plots, histograms, etc.
To enable the ipympl backend, users can include the magic command %matplotlib ipympl at the beginning of a Jupyter Notebook or JupyterLab session. Before including this magic command, we must also install it using ?pip install ipympl'.
Syntax
To create an empty Figure in Matplotlib using ipympl backend, you need to follow the following syntax ?
%matplotlib ipympl
import matplotlib.pyplot as plt
fig = plt.figure(figsize=(width, height))
plt.show()
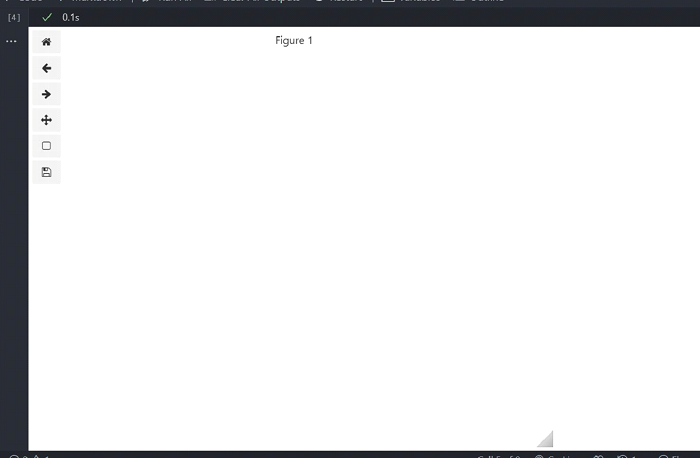
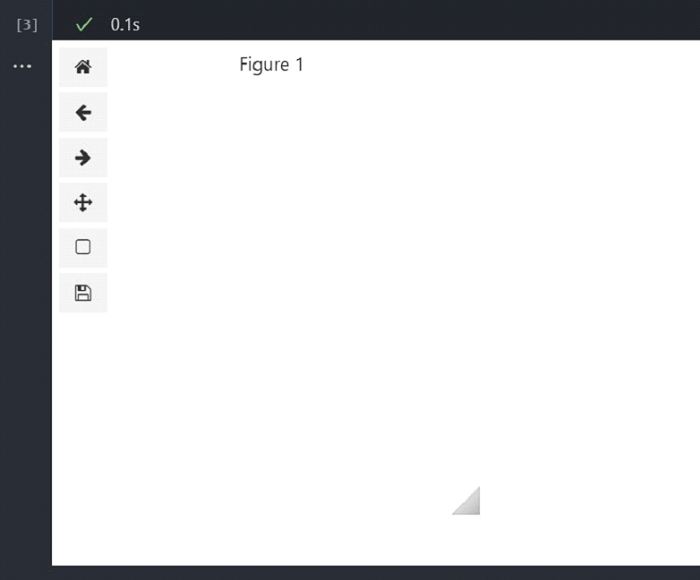
The rest of the code and syntax remains the same as in the previous method. The extra part is just the ipympl backend is included. It will create an empty interactive figure in the Jupyter notebook; this time, we can see the empty white figure.
Example 1
We used the magic command %matplotlib ipympl at the top. Next, we followed the same steps as in the previous method and used the plt.figure function without any parameters to create the empty figure.
%matplotlib ipympl
import matplotlib.pyplot as plt
fig = plt.figure()
plt.show()
Output

Example 2
The ipympl backend will not work in Google colaboratory as the custom widget managers are disabled by default. So, before using the ipympl backend, we have to enable the custom widget managers in google colab with the following code ?
from google.colab import output
output.enable_custom_widget_manager()
%matplotlib ipympl
import matplotlib.pyplot as plt
fig = plt.figure(figsize=(3, 3))
plt.show()
Now, the ipympl code will work in google colab as it works in jupyter notebook.
Output

We learned how to create an empty figure with Matplotlib in Python using the ipympl backend of Jupyter notebook. This allows us to create interactive figures in Jupyter notebook. Also, in our example, we can see the empty white figure as output.

