- BigQuery - Home
- BigQuery - Overview
- BigQuery - Initial Setup
- BigQuery vs Local SQL Engines
- BigQuery - Google Cloud Console
- BigQuery - Google Cloud Hierarchy
- What is Dremel?
- What is BigQuery Studio?
- BigQuery - Datasets
- BigQuery - Tables
- BigQuery - Views
- BigQuery - Create Table
- BigQuery - Basic Schema Design
- BigQuery - Alter Table
- BigQuery - Copy Table
- Delete and Recover Table
- BigQuery - Populate Table
- Standard SQL vs Legacy SQL
- BigQuery - Write First Query
- BigQuery - CRUD Operations
- Partitioning & Clustering
- BigQuery - Data Types
- BigQuery - Complex Data Types
- BigQuery - STRUCT Data Type
- BigQuery - ARRAY Data Type
- BigQuery - JSON Data Type
- BigQuery - Table Metadata
- BigQuery - User-defined Functions
- Connecting to External Sources
- Integrate Scheduled Queries
- Integrate BigQuery API
- BigQuery - Integrate Airflow
- Integrate Connected Sheets
- Integrate Data Transfers
- BigQuery - Materialized View
- BigQuery - Roles & Permissions
- BigQuery - Query Optimization
- BigQuery - BI Engine
- Monitoring Usage & Performance
- BigQuery - Data Warehouse
- Challenges & Best Practices
BigQuery - Monitoring Usage & Performance
Understanding usage and performance constraints is critical, especially for those working within an organization. Maintaining constant visibility regarding users and data sources that are consuming disproportionate amounts of slot time can help BigQuery administrators make informed decisions about limiting access to resources and spawn productive conversations among teams who run resource-intensive jobs.
Performance Dashboards
To achieve more transparent real-time monitoring, BigQuery has made performance dashboards available in the monitoring tab within the BigQuery Studio UI.
Note − Performance is charted each time a query is executed.
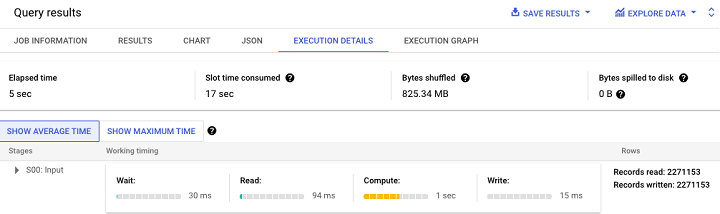
Additionally, BigQuery provides an execution graph for a more visually-friendly interpretation of query performance.

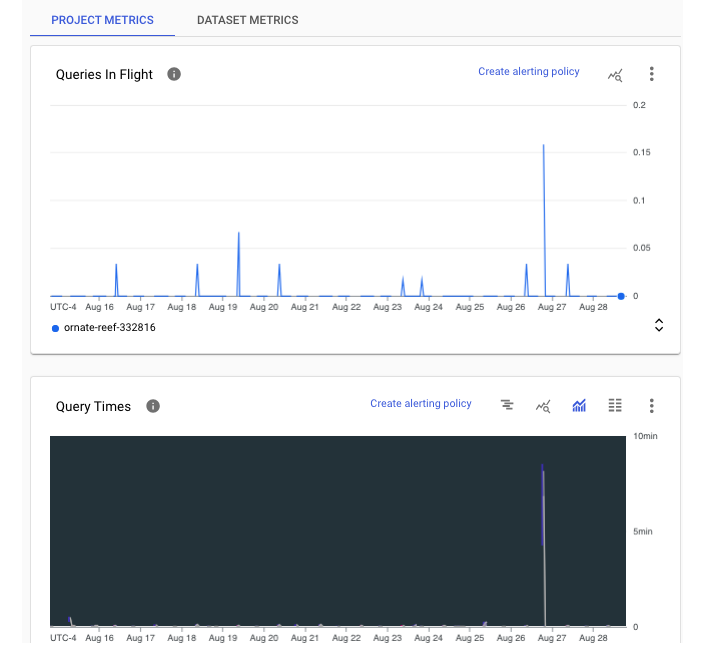
On a project level, administrators can view BigQuery data within the "Monitoring" dashboard. Monitoring is available at project level and dataset level.
Project Level Monitoring
The project level shows how many queries are currently running or "in flight".
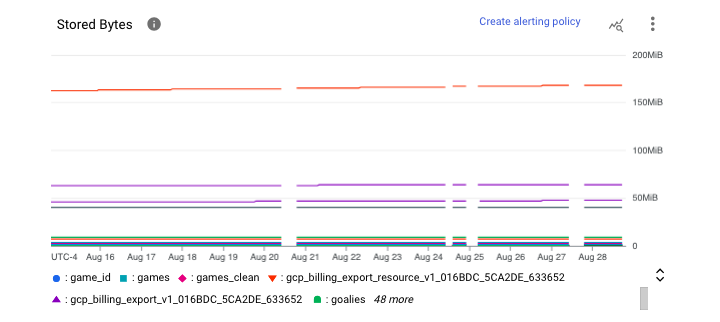
Dataset Level Monitoring
At a dataset level, we can see stored bytes per table.
To access and manipulate these charts, follow these steps −
- Navigate to BigQuery
- Select Administration
- Click Monitoring
- If desired: Toggle live data
Within this UI, users can also access Operational Health, which offers information in the form of two different views: A summary view and a more detailed view.
Some top line metrics within Operational Health summary tables that both administrators and users would find helpful include −
- Slot usage
- Shuffle (reservation re-allocation) usage
- Concurrency (simultaneous jobs)
- Bytes processed
- Job duration
- Total storage
Note − Usage units are bytes (can be converted to gigabytes or terabytes if necessary).
For a more granular view, users can query the INFORMATION_SCHEMA views using the metadata query techniques from earlier in this tutorial.
Common Errors of BigQuery
Despite being armed with education and information regarding BigQuery features, like any development process, errors are possible and, in fact, are likely inevitable. New users are particularly susceptible to BigQuery errors given their inexperience with the platform.
Types of BigQuery Errors
BigQuery errors present in two categories −
- Code-based errors
- Platform-based errors
Although BigQuery's SQL dialect (Google SQL) is intended to be universally understood and reminiscent of other SQL dialects, syntax errors can occur and, frankly, can be quite frustrating.
BigQuery Syntax Errors
Here is a non-exhaustive list of BigQuery syntax mistakes −
- Using apostrophes instead of backticks.
- Omitting either the dataset or table in a FROM clause.
- Using UNNEST() incorrectly (on a STRUCT instead of an ARRAY).
- Forgetting a GROUP BY clause when using an aggregate function like AVG().
- Forgetting a comma between column names.
Platform-based Errors
Platform-based errors stem from misunderstanding BigQuery's execution constraints and may include −
- Running more than 20 concurrent queries.
- Not writing the results of a large query to a table resulting in a "result too large" error.
- Not running a large query as a batch job.
- Overwriting or truncating a table instead of appending a result.
Unfortunately, it is impossible to flag nearly every error a new BigQuery SQL developer will encounter. However, the above represent a broad variety of issues you may encounter.
