- ASP.NET - Home
- ASP.NET - Introduction
- ASP.NET - Environment
- ASP.NET - Life Cycle
- ASP.NET - First Example
- ASP.NET - Event Handling
- ASP.NET - Server Side
- ASP.NET - Server Controls
- ASP.NET - HTML Server
- ASP.NET - Client Side
- ASP.NET - Basic Controls
- ASP.NET - Directives
- ASP.NET - Managing State
- ASP.NET - Validators
- ASP.NET - Database Access
- ASP.NET - ADO.net
- ASP.NET - File Uploading
- ASP.NET - Ad Rotator
- ASP.NET - Calendars
- ASP.NET - Multi Views
- ASP.NET - Panel Controls
- ASP.NET - AJAX Control
- ASP.NET - Data Sources
- ASP.NET - Data Binding
- ASP.NET - Custom Controls
- ASP.NET - Personalization
- ASP.NET - Error Handling
- ASP.NET - Debugging
- ASP.NET - LINQ
- ASP.NET - Security
- ASP.NET - Data Caching
- ASP.NET - Web Services
- ASP.NET - Multi Threading
- ASP.NET - Configuration
- ASP.NET - Deployment
ASP.NET - Debugging
Debugging allows the developers to see how the code works in a step-by-step manner, how the values of the variables change, how the objects are created and destroyed, etc.
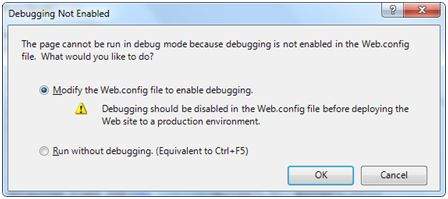
When the site is executed for the first time, Visual Studio displays a prompt asking whether it should be enabled for debugging:
When debugging is enabled, the following lines of codes are shown in the web.config:
<system.web>
   <compilation debug="true">
      <assemblies>
      ..............
      </assemblies>
   </compilation>
</system.web>
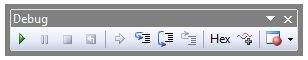
The Debug toolbar provides all the tools available for debugging:
Breakpoints
Breakpoints specifies the runtime to run a specific line of code and then stop execution so that the code could be examined and perform various debugging jobs such as, changing the value of the variables, step through the codes, moving in and out of functions and methods etc.
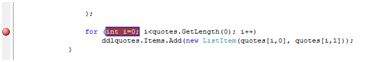
To set a breakpoint, right click on the code and choose insert break point. A red dot appears on the left margin and the line of code is highlighted as shown:
Next when you execute the code, you can observe its behavior.
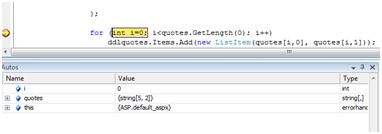
At this stage, you can step through the code, observe the execution flow and examine the value of the variables, properties, objects, etc.
You can modify the properties of the breakpoint from the Properties menu obtained by right clicking the breakpoint glyph:
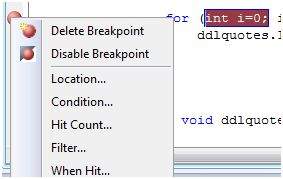
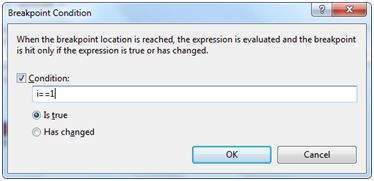
The location dialog box shows the location of the file, line number and the character number of the selected code. The condition menu item allows you to enter a valid expression, which is evaluated when the program execution reaches the breakpoint:
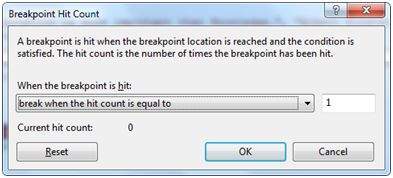
The Hit Count menu item displays a dialog box that shows the number of times the break point has been executed.
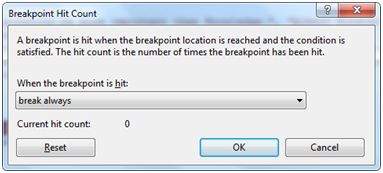
Clicking on any option presented by the drop down list opens an edit field where a target hit count is entered. This is particularly helpful in analyzing loop constructs in code.
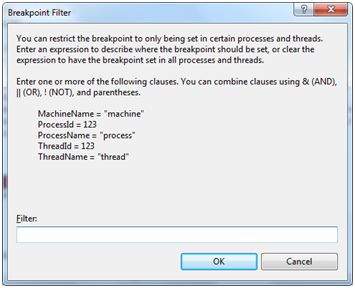
The Filter menu item allows setting a filter for specifying machines, processes, or threads or any combination, for which the breakpoint will be effective.
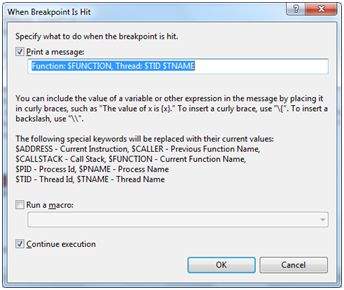
The When Hit menu item allows you to specify what to do when the break point is hit.
The Debug Windows
Visual Studio provides the following debug windows, each of which shows some program information. The following table lists the windows:
| Window | Description |
|---|---|
| Immediate | Displays variables and expressions. |
| Autos | Displays all variables in the current and previous statements. |
| Locals | Displays all variables in the current context. |
| Watch | Displays up to four different sets of variables. |
| Call Stack | Displays all methods in the call stack. |
| Threads | Displays and control threads. |
