- Web Analytics - Home
- Web Analytics - Introduction
- Web Analytics - Google Analytics
- Web Analytics - Optimizely
- Web Analytics - Kissmetrics
- Web Analytics - Crazy Egg
- Web Analytics - Key Metrics
- Web Analytics - Data Sources
- Web Analytics - Segmentation
- Web Analytics - Dashboards
- Web Analytics - Conversion
- Web Analytics - Emerging Analytics
- Web Analytics - A/B Testing
- Automated Reporting & Annotation
- Actionable Reporting
- Analytics Terminology
Web Analytics - Quick Guide
Web Analytics - Introduction
What is Web Analytics?
Web Analytics is the methodological study of online/offline patterns and trends. It is a technique that you can employ to collect, measure, report, and analyze your website data. It is normally carried out to analyze the performance of a website and optimize its web usage.
We use web analytics to track key metrics and analyze visitors activity and traffic flow. It is a tactical approach to collect data and generate reports.
Importance of Web Analytics
We need Web Analytics to assess the success rate of a website and its associated business. Using Web Analytics, we can −
- Assess web content problems so that they can be rectified
- Have a clear perspective of website trends
- Monitor web traffic and user flow
- Demonstrate goals acquisition
- Figure out potential keywords
- Identify segments for improvement
- Find out referring sources
Web Analytics Process
The primary objective of carrying out Web Analytics is to optimize the website in order to provide better user experience. It provides a data-driven report to measure visitors flow throughout the website.
Take a look at the following illustration. It depicts the process of web analytics.
Set the business goals.
To track the goal achievement, set the Key Performance Indicators (KPI).
Collect correct and suitable data.
To extract insights, Analyze data.
Based on assumptions learned from the data analysis, Test alternatives.
Based on either data analysis or website testing, Implement insights.
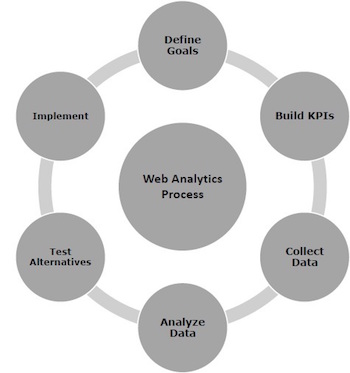
Web Analytics is an ongoing process that helps in attracting more traffic to a site and thereby, increasing the Return on Investment.
Web Analytics - Google Analytics
Analytics Tools offer an insight into the performance of your website, visitors behavior, and data flow. These tools are inexpensive and easy to use. Sometimes, they are even free.
Google Analytics
Google Analytics is a freemium analytic tool that provides a detailed statistics of the web traffic. It is used by more than 60% of website owners.
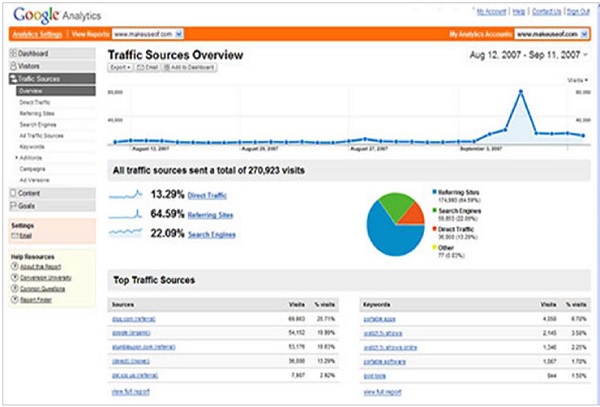
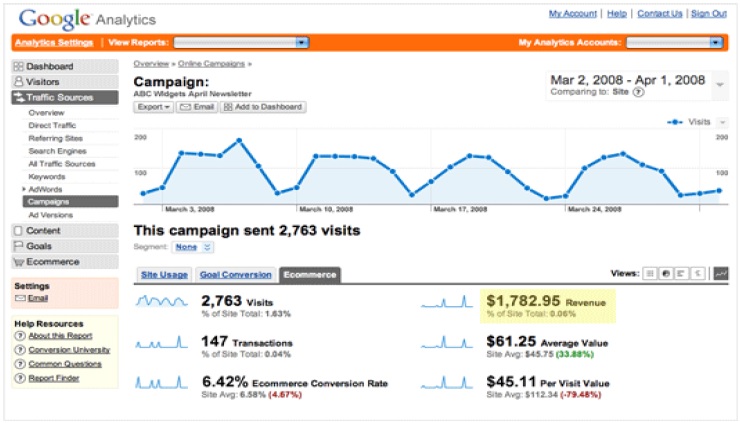
Google analytics helps you to track and measure visitors, traffic sources, goals, conversion, and other metrics (as shown in the above image). It basically generates reports on −
- Audience Analysis
- Acquisition Analysis
- Behavior Analysis
- Conversion Analysis
Let us discuss each one of them in detail.
Audience Analysis
As the name suggests, audience analysis gives you an overview of the audience who visit your site along with their session history, page-views, bounce rate, etc. You can trace the new as well as the returning users along with their geographical locations. You can track −
The age and gender of your audience under Demographics.
The affinity reach and market segmentation under Interests.
Language and location under Geo.
New and returning visitors, their frequency, and engagement under Behavior.
Browsers, Operating systems, and network of your audience in Technology.
Mobile device info under Mobile.
Custom variable report under Custom. This report shows the activity by custom modules that you created to capture the selections.
Benchmarking channels, locations, and devices under Benchmarking. Benchmarking allows you to compare your metrics with other related industries. So, you can plot what you need to incur in order to overtake the market.
Flow of user activity under Users flow to see the path they took on your website.
Acquisition Analysis
Acquisition means to acquire. Acquisition analysis is carried out to find out the sources from where your web traffic originates. Using acquisition analysis, you can −
Capture traffic from all channels, particular source/medium, and from referrals.
Trace traffic from AdWords (paid search).
See traffic from search engines. Here, you can see Queries, triggered landing pages, and geographical summary.
Track social media traffic. It helps you to identify networks where your users are engaged. You can see referrals from where your traffic originates. You can also have a view of your hub activity, bookmarking sites follow-up, etc. In the same tab, you can have a look at your endorsements in details. It helps you measure the impact of social media on your website.
See which plug-ins gave you traffic.
Have a look at all the campaigns you built throughout your website with detailed statistics of paid/organic keywords and the cost incurred on it.
Behavior Analysis
Behavior analysis monitors users activities on a website. You can find behavioral data under the following four segments −
Site Content − It shows how many pages were viewed. You can see the detailed interaction of data across all pages or in segments like content drill-down, landing pages, and exit pages. Content drill-down is breaking up of data into sub-folders. Landing page is the page where the user lands, and exit page is where the user exits your site. You can measure the behavioral flow in terms of content.
Site Speed − Here, you can capture page load time, execution speed, and performance data. You can see how quickly the browser can parse through the page. Further, you can measure page timings, user timings, and get speed suggestion. It helps you to know where you are lagging.
Site Search − It gives you a full picture of how the users search across your site, what they normally look for, and how they arrive at a particular landing page. You can analyze what they search for before landing on your website.
Events − Events are visitors actions with content, which can be traced independently. Example − downloads, sign up, log-in, etc.
Conversion Analysis
Conversion is a goal completion or a transaction by a user on your website. For example, download, checkout, buy, etc. To track conversions in analytics, you need to define a goal and set a URL that is traceable.
Goals − Metrics that measure a profitable activity that you want the user to complete. You can set them to track the actions. Each time a goal is achieved, a conversion is added to your data. You can observe goal completion, value, reverse path, and goal flow.
Ecommerce − You can set ecommerce tracking to know what the users buy from your website. It helps you to find product performance, sale performance, transactions, and purchase time. Based on these data, you can analyze what can be beneficial and what can incur you loss.
Multi-channel funnels − Multi-channel funnels or MCF reports the source of conversion; what roles the website plays, referrals role in that conversion; and what all slabs did when users pass through landing page to conversion. For example, a user searched for a query on Google search page, he visited the website, but did not convert. Later on, he directly typed your website name and made a purchase. All these activities can be traced on MCF.
Attribution − Attribution modeling credits sales and conversions to touch points in conversion tracking. It lets you decide what platforms or strategy or module is the best for your business. Suppose a person visited your website through AdWords ad and made no purchase. A month later, he visits via a social platform and again does not buy. Third time, he visited directly and converted. Here, the last interaction model will credit direct for the conversion, whereas first interaction model will assign credit to paid medium. This way, you can analyze what module should be credited for a conversion.
Web Analytics - Optimizely
Optimizely is an optimization platform to test and validate changes and the present look of your webpage. It also determines which layout to finally go with. It uses A/B Testing, Multipage, and Multivariate Testing to improve and analyze your website.
A wonderful feature of Optimizely is that you do not need to be a technical expert. You just need to insert a deployed code provided by Optimizely in your HTML. After putting it, you can trace anything, take any action, and make any changes in your website.
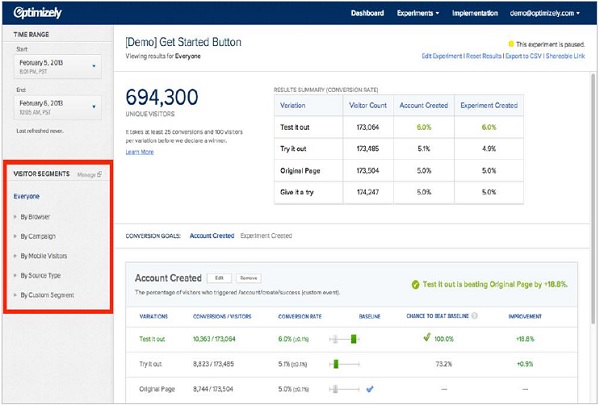
Optimizely provides you administrative and management functionality to let you create account, organize projects, and experiment. This facility helps you in tracking clicks, conversions, sign-ups, etc.
You are allowed to run tests and use custom integrations with Optimizely interface. All you need is −
Set up an account on Optimizely and add a generated script.
Once you are done with it, select your test pages. It implies the factors you want to run test on.
Set Goals. To set goals, click on the flag icon at the top right of the page and follow up the instructions. Check metrics you are looking for. Click Save.
You can create variations with the usual editor like changing text and images.
Next step is monitoring your tests. You need to test which landing pages are performing well. What is attracting the visitors? What is the bounce rate? Understand the statistics, filter the non-performing areas, and conclude the test.
You can run multipage tests using javascript editors.
Optimizely gives you a better understanding of conversion rate optimization and running tests.
Web Analytics - KISSmetrics
KISSmetrics is a powerful web analytics tool that delivers key insights and user interaction on your website. It defines a clear picture of users activities on your website and collects acquisition data of every visitor.
You can use this service free for a month. After that, you can switch on to a paid plan that suits you. KISSmetrics helps in improving sales by knowing cart-abandoned products. It helps you to know exactly when to follow up your customers by tracking the repeat buyers activity slot.
KISSmetrics helps you identify the following −
- Cart size
- Landing page conversion rate
- Customer activity on your portal
- Customer bounce points
- Cart abandoned products
- Customer occurrence before making a purchase
- Customer lifetime value, etc.
Summarizing KISSmetrics
It gets you more customers by not letting you lose potential customers and maintaining brand loyalty.
It lets you to judge your decisions where you are playing right.
It helps you identify data and trends, which contribute in customer acquisition.
Best Features of KISSmetrics
- Ability to track effective marketing channels.
- Figure out how much time a user takes to convert.
- Determine a degree of which user was engaged with your site.
- A convenient dashboard. You do not need to run around searching for figures.
Installation
Just sign-up for an account and customize accordingly.
Tracking
Add a java snippet under <head> tag of the source code of your website.
Event Setting
By default, KISSmetrics sets two events for you − visited site and search engine hit. To add more events, click on new event, add an attribute and record an event name.
Setting up Metrics
Click on create a new metric. Select your metric type from the list. Give metric name, description, and event. Save metric.
Define Conversions
Define your conversion and track them. Select number of times event happened. Give metric name and description and select event. Save metric again.
KISSmetrics can track web pages, mobile apps, mobile web, facebook apps, and can blend all data into one. You dont need the multiple analytics platforms.
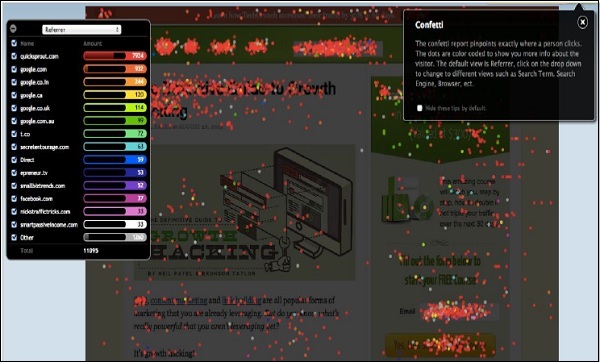
Web Analytics - Crazy Egg
Crazy Egg is an online analytics application that provides you eye-tracking tools. It generates heatmaps based on where people clicked on your website. Thus, it gives you an idea on where to focus. It lets you filter data on top 15 referrers, search terms, operating systems, etc.
To use Crazy Egg, a small piece of JavaScript code needs to be placed on your site pages.
Once the code is on your site, Crazy Egg will track user behavior. Your servers will create a report that shows you the clicks on the pages you are tracking. You can review the reports in the dashboard within the members area of the Crazy Egg site. Setting up Crazy Egg is a quick and easy task.
It offers you insights in four different ways −
Heatmaps − It gives you a defined picture of where visitors who clicked on your page. Where you need to make changes so as to improve conversions.
Scrollmaps − It gives you insights of to what length people scroll down on your page. With Crazy Egg, you can ensure where people leave your page and where to hold them exactly and where to add more to hold them for longer.
Overlay Tool − It gives you overlay report of the number of clicks occurring on your website. You may be able to get more on it.
Confetti − Confetti distinguishes clicks for you segmented by referral sources, search terms, etc. Now, you know the origin of your clicks, so you uncover the traffic sources. Put extra efforts there and you will earn more traffic and revenue.
Installation
Insert JavaScript code on source code of your website. Crazy Egg will by default track the user behavior. The servers generate reports providing you the view. Set dashboard to review the reports.
Web Analytics - Key Metrics
You need to find a few key metrics for your business. You have a website and it has a tracking code in it. Now, you need to make sure what are you going to measure. Analyzing may help you retain your customer and hold them.
What to Measure
Audience
Pageviews − Pageviews is the number of views of a page. Multiple pageviews are possible in a single session. If pageviews is improved, it will directly influence AdSense revenue and average time on website.
Bounce rate − Bounce rate reflects the percentage of visitors returning back only after visiting one page of your website. It helps you to know how many visitors do so. If the bounce rate of a website increases, its webmaster should be worried.
Pages per session − Pages/session is the number of pages surfed in a single session. For example, a user landed on your website and surfed 3 pages, then the website pages/session is 3.
Demographic info − Demographic data shows Age and Gender. With the help of Demographic Info, you can find the percentage of Male/Female visitors coming to your website. Analyzing the ratio of this data, you can make a strategy according to genders. Age group data help you find what percentage of age group visiting your website. So, you can make a strategy for highest percentage of age group visitors.
Devices − This data shows the devices info. In devices info, you can easily find how many percentage of visitors come from mobile, how many come from desktop, how many come from tablets, etc. If mobile traffic is high, then you need to make your website responsive.
Acquisition
Traffic sources − In the acquisition, you have to check all your sources of the traffic. Major sources of the traffic are −
Organic traffic is the traffic coming through all search engines (Google, Yahoo, Bing....)
Social traffic is the traffic coming through all social media platforms (like − Facebook, Twitter, Google+, ...)
Referral traffic is the traffic coming through where your website is linked.
Direct traffic is the traffic coming directly to your website. For example, typing the url of your website, clicking on the link of your website given in emails, etc.
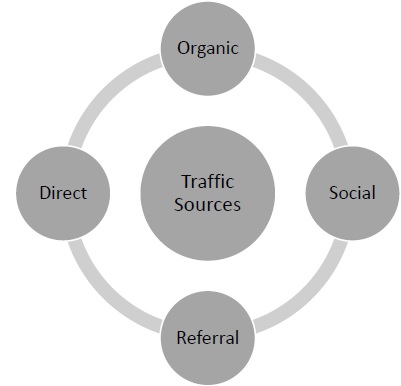
Source/Medium − This metrics gives you an idea of the sources from where you are getting traffic (Google, Yahoo, Bing, Direct, Facebook...).
Site Content
Landing pages − Landing pages are the pages where the visitors land first (normally, home pages of the websites are the landing pages). With the help of this metrics, you can find the top pages of the website. Using this metrics, you can analyze how many pages are getting 50% or more traffic of the website. So, you can easily find which type of content is working for you. Further, based on this analysis, you can plan the next content strategy.
Site speed − Site speed is the metrics used for checking page timing (average page load time). Using this metrics, you can find which page is taking more time to load, how many pages have high load time, etc.
Web Analytics - Data Sources
Data sources are simply the files created on DBM or feed. The objective of keeping a data source is to encapsulate all information in one stack and hide it from the users, e.g., payroll, inventory, etc.
Server Logs
Log files list actions that take place. They maintain files for every request invoked, for example, the source of visitor, their next action, etc.
Server logs is a simple text file that records activity on the server. It is created automatically and maintained by servers data. With the help of a server log file, you can find the activity detail of the website/pages. In activity sheet, you can find the data with IP address, Time/Date, and pages. It gives you insight on the type of browser, country, and origin. These files are only for the webmasters, not for the website users. The statistics provided by server log is used to examine traffic patterns segmented by day, week, or a referrer.
Visitors' Data
Visitors data shows the total traffic of the website. It can be calculated by any web analytics tool. With the help of visitors data, you can analyze your website improvement and can update your servers accordingly. It may comprise of −
- A top-level view of metrics
- Age and Gender of visitors
- User behavior, their location and interests
- Technology they are using, e.g., browsers and operating systems
- Breakdown of your website on devices other than desktops
- User Flow
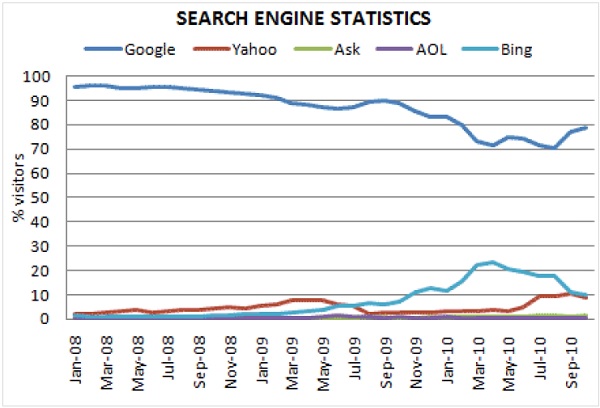
Search Engine Statistics
Search engine statistics show the data that is acquired by organic traffic (as shown in the image given below). If the search engine traffic of a website has improved, then it means the website search ranking for the main keywords has improved. This data also helps you to −
- Find the revenue generating keywords and the keywords those are typed in search engine by visitors.
- How different Search Engines affect your data.
- Where you are lagging and where you need to focus.
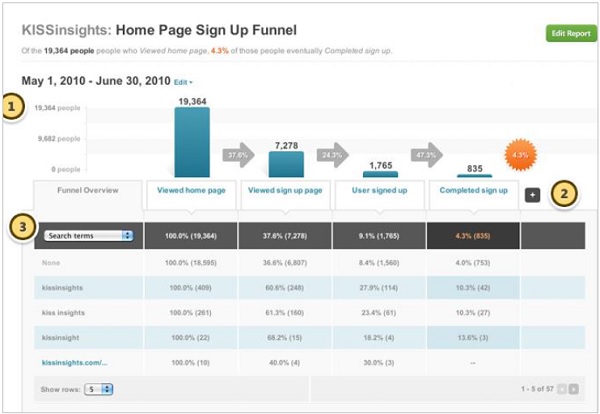
Conversion Funnels
Conversion funnels is the path by which a goal (Product purchase, Lead form done, Service contact form submitted, etc.) is completed. It is a series of steps covered by the visitors to become customers. It is explained in the Bertus Engelbrechts image, given below. If more numbers of visitors are leaving the website without any purchase, then you can use conversion funnels to analyze the following −
Why are they leaving the website?
Is there any problem with the conversion path?
Is there any broken link in the conversion path or any other feature that is not working in the conversion path?
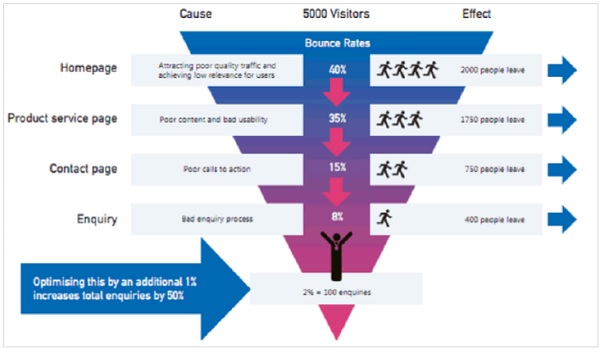
Conversion funnels help you visualize the following aspects in the form of graphics −
- The hurdles the users are facing before converting
- Where the emotional behaviors of the users alter
- Where the technical bugs become nuisance for the customers
Web Analytics - Segmentation
Segmentation is the process that segregates the data to find the actionable items. For example, you can categorize your entire website traffic data as one segment for a Country, and one for a specific City.
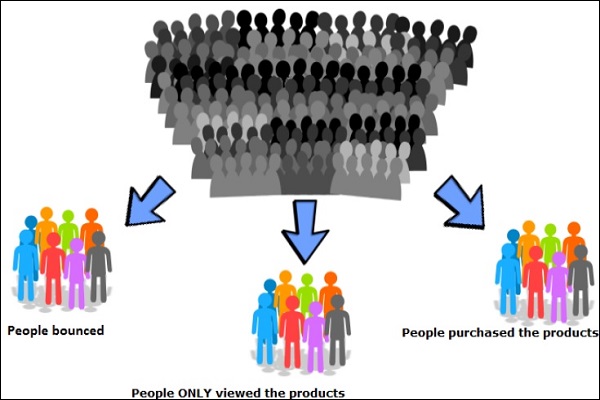
For the users, you can make the segments as one who purchased your products; one who only visited your website, and likewise. During the remarketing, you can target those audiences with the help of this segment.
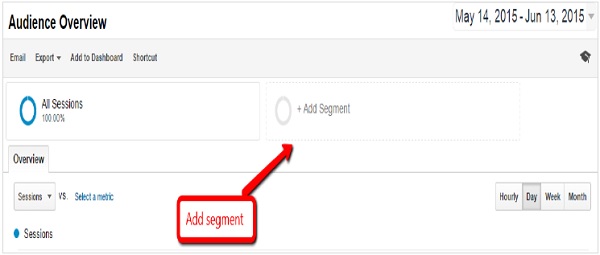
Data Segmentation
Data segmentation is very useful to analyze website traffic. In analytics, you can analyze traffic insight with the help of segmentation. The following image shows how to add segments in Google analytics.
For a website, you can segment total traffic according to Acquisition, Goals, and Channels. Following are the types of acquisition segmentation −
Organic Traffic − It shows only the organic traffic of the website. You can find which search engine (Google, Yahoo, Bing, Baidu, Aol, etc.) is working for you. With the help of organic traffic, you can also find the top keywords that send traffic to your website.
Referrals Traffic − This segment shows the total referrals traffic of the website. With the help of this segment, you can find the top referrals website that send traffic to your website.
Direct Traffic − This segment helps you find the traffic that visit your website directly.
Social Traffic − With the help of social segment, you can analyze social traffic. How much traffic you are getting from social media? In social media, which platform (Facebook, G+, Twitter, Pinterest, Stumbleupon, Reddit, etc.) is sending traffic to your website. With the help of this segment, you can make future social media strategy. For example, if Facebook is sending the highest traffic to your website, then you can improve your Facebook post frequency.
Paid Traffic − Paid traffic segment captures traffic through paid channels (Google AdWords, Twitter ads...).
Analysis Using Segmentation
When you are done with your segments (collected the data from segments), then the next step is analysis. Analysis is all about finding the actionable item from the data.
Example
Lets map a table for analysis.
| Month | Jan | Feb | Mar | April | May | June | July | Aug | Sep |
|---|---|---|---|---|---|---|---|---|---|
| Organic | 40K | 42K | 40K | 43K | 45K | 47K | 57K | 54K | 60K |
| Referrals | 5K | 4K | 5K | 4K | 6K | 5K | 4K | 3K | 4K |
| Social | 1K | 1K | 2K | 4K | 2K | 3K | 5K | 5K | 4K |
Analysis
From the above table, you can see that your organic traffic is growing (improved 20k in 9 months). Referrals traffic is going down. Social traffic has also improved (1k to 4k).
Find out the pages that send traffic in organic traffic. Analyze them.
Find out which social platform is working for you
Actionable
Add new pages according to organic traffic sender pages.
Focus on the social media platform that is sending the highest traffic.
Find why your referrals traffic is going down. Is any link removed from the website, which was sending traffic earlier?
Web Analytics - Dashboards
Dashboard is an interface showing graphical status of the trends of your business key performance indicators. This helps you to take instantaneous and intelligent decisions. It gives you a visual display of important data that can be encapsulated in a single space to let you monitor in a glance.
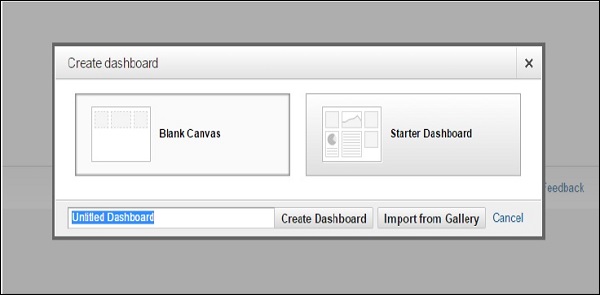
Dashboard Implementation
In Google analytics, you can create dashboards according to your requirements. Dashboards are used for finding data. With the help of dashboards, you can quickly analyze the data. In dashboard, you have to create widgets as per your requirements.
The following image shows how to create a dashboard −
Types of Dashboards
You can create dashboards according to your requirements. Following are the main types of dashboards −
- SEO dashboardContent dashboard
- Content dashboard
- Website performance dashboard
- Real time overview dashboard
- Ecommerce dashboard
- Social Media dashboard
- PPC dashboard
In every dashboard, you have to create widgets. Widgets are form in graphical or in numbers.
For example, if you want to create a dashboard for SEO, you have to create a widget for the total traffic, for the organic traffic, for the keywords, etc. You can analyze these metrics with the help of SEO dashboard.
If you want to create a dashboard for website performance, then you have to create a widget for website avg. page load time, Website server response time, Page load time for mobile, and Check page load time by browser. With the help of these widgets, you can easily analyze the website performance.
Metrics for Every Dashboard
Search Engine Optimization (SEO) − Organic traffic, Website total traffic, Keyword used in Organic, Top landing pages, etc.
Content − In content dashboard, you have to monitor traffic for blog section, Conversion by blog post, and Top landing page by exit.
Website Performance Dashboard − Avg. page load time, Mobile page load time, Page load time by browser, and Website server response time.
Real Time Overview Dashboard− In real time overview, you can set a widget for real time traffic, Real time traffic source, and real time traffic landing pages.
Ecommerce Dashboard − In ecommerce total traffic, Landing by products, and Total sale by products.
Social Media Dashboard − In social media traffic by social media channel, Sale by social media, most socially shared content.
PPC dashboard − In pay per click (PPC) dashboard, you need to include clicks, impressions, CTR, converted clicks, etc.
Web Analytics - Conversion
Conversion is when a user visits your page and performs an action, for example, purchase, sign-up, download, etc.
Goals
Goals are used in analytics for tracking completions of specific actions. With the help of goals, you can measure the rate of success. Goals are measured differently in different industries. For example, in an e-commerce website you can measure the goal when a product gets sold. In a software company, you can measure the goal when a software product is sold. In a marketing company, goals are measured when a contact form is filled.
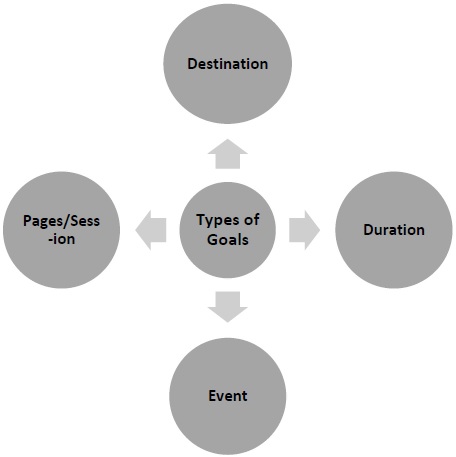
Types of Goals
Goals can be divided into the following categories −
Destination Goal − Destination goal is used to find pageviews of a website. Put a destination URL in the destination field to complete your goal.
Duration Goal − You can measure the user engagement with the help of duration goal. You can specify hours, minutes, and second field to quantify the goals. If a user spends more than that much of time on the page, then the goal is completed.
Event Goals − You can measure user interaction with your event on the site. It is called as event goals. You must have at least one event to compose this goal.
Pages/session Goal − You can measure the user engagement with pages/session goal. First, you have to specify how many pageviews/session counts as goal complete. Then, with the help of goal metric, you can analyze how many goals are completed.
Funnels
Funnels are the steps to complete your goals. With the help of funnels, you can review your goals completion steps. Lets suppose for an ecommerce company, product sale is goal completion. So, funnels are the steps to purchase that product. If most of the visitors leave the website after carting the products, then you have to check why users are leaving. Is there any problem with the cart section? This can help you improve your product performance or steps to sale the products.
Multi-Channel Funnels
Multi-Channel Funnel (MCF) report shows how your marketing channels work together. MCF report shows that how many conversions are done and by which channel. In MCF report, you can find the following data −
Assisted Conversion − In assisted conversion, you can find which channel has assisted the highest number of conversions.
Top Conversion Path − Top conversion path report shows the following picture.
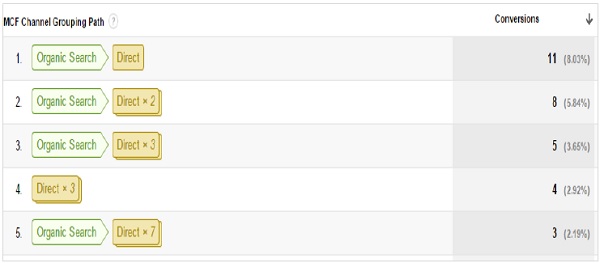
In the above picture, you can see that Organic search > > Direct has 11 conversions. It means the user first interacts with your product via organic search. Later on, he/she comes to the website direct and makes a purchase. So, with the help of this report, you can easily analyze your top conversion path to improve your funnels.
Web Analytics - Emerging Analytics
You need to leverage data to drive insights in order to learn customers behavior on your website. There is nothing new in it. What alters the game is emerging analytics trends in Social Media, E-commerce, and Mobile, as these are new game changers in digital world.
Social Media Analytics
Social Media Analytics comprise of gathering data from social media platforms and analyzing it to derive information to make business decisions. It provides powerful customer insight to uncover sentiments across online sources. You tend to take control of Social Media Analytics in order to predict customers behavior, discover patterns and trends, and make quick decisions to improve online reputation. Social Media Analytics also let you identify primary influencers within specific network channels. Some of the popular social media analytics tools are discussed below.
Google Social Analytics
It is a free tool that lets you add social media results to your analysis report. You get to know what is in air about your business. How many people interacted with your website through social media and how many liked and shared your content.
SumAll
It combines Twitter, Facebook, and Google Plus into one dashboard to give you an overall view of what people are talking about you on social media.
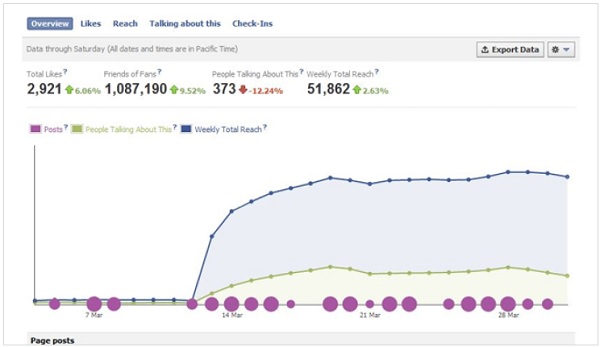
Facebook Insights
Facebook plays a major role in your marketing campaign. You need to familiarize yourself with Facebook data to mark a flag. You need to set up a page for your business to get the insights. It gives you information about who visited your page, saw your post, liked your page, and shared it (as shown in the following image).
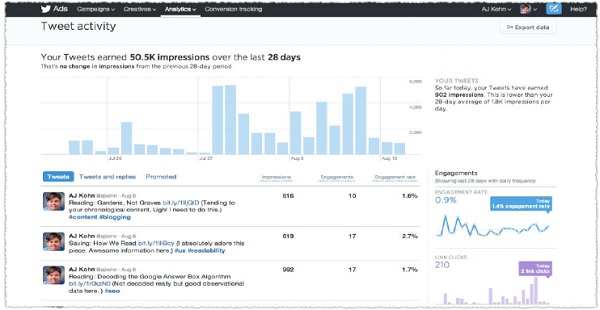
Twitter Analytics
Twitter Analytics show how many impressions each tweet received, what is your engagement status, and when were you on peak (see the image given below).
E-commerce Analytics
Business owners need to survive and thrive among tough competition. They have to become big decision makers in order to survive in the market. This is where Web Analytics play a critical role.
E-commerce Analytics let you figure out customers acquisition, users behavior, and conversion. In Google Analytics, you can get relevant information about your volume of sales, product with revenue, and sources of conversion occurred. You need to keep all this information to find out where your business stands and to boost e-commerce sales, generate leads, and enhance brand awareness.
Mobile Analytics
Mobiles have emerged as one of the most significant tools in the past two decades. It changes the way people communicate and innovate. This has led to marketing driven by mobile apps.
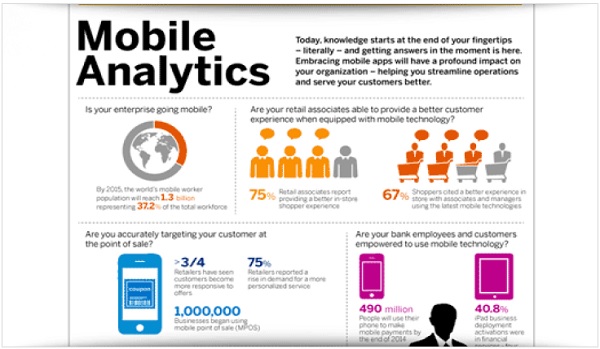
Mobile apps have proved easy to access and engaging. Webmasters and online business makers need to take support of mobile apps to make their way perfect. Once you are done with making a mobile app, youll need to acquire new users, engage with them, and earn revenue. For this, you need mobile analytics. It helps marketers to measure their apps better. For example −
- How many people are using your app
- How to optimize user experience
- How to prioritize
- What operating system to focus on
- How to visualize navigation path, etc.
Web Analytics A/B Testing
A/B Testing or split testing is a comparison between two variants of one aspect, say, two versions of a webpage. It is like running an experiment between two or more pages simultaneously to discover which one has the potential to convert more.

For example, e-Commerce websites use A/B testing on products to discover which product has the potential to earn more revenue. Second example is AdWords campaign manager running two ads for the same campaign in order to know which of them works well.
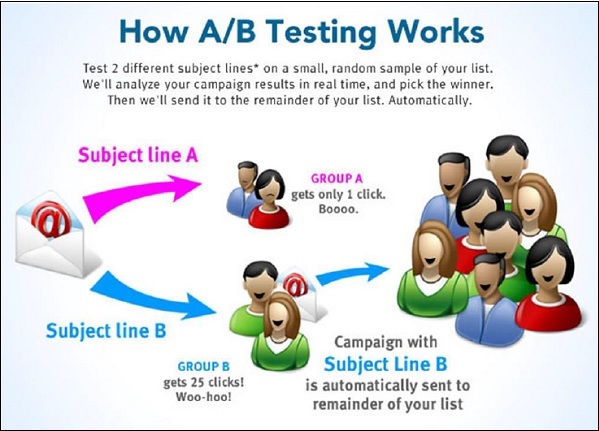
A/B testing allows you to extract more out of your existing traffic. You can run A/B Testing on Headlines, Ads, Call to action, Links, Images, Landing pages, etc
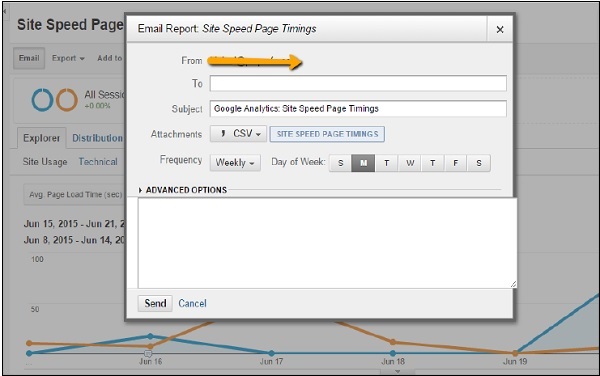
Automated Reporting & Annotation
In Google analytics, we can set an automated reporting. If we want on every Monday a report having the top 10 landing pages of the website, then in the email section, we can set a report that is automatically sent to users.
Annotation
With the help of annotations, we can find what tasks have been done at which date. We can annotate the update in Google Analytics. Let us suppose Google search update arrived on 21 March, then we can annotate 21 March as Google update. Annotation helps us find the impact of the change.
Web Analytics - Actionable Reporting
Actionable reporting is the final part of the analytics analysis. When you are done with collecting data, the next step is actionable reporting. Graphics of the data helps to write actionable points. Always try to build graphs that show data trends because visuals depict more information than plain text.
How to Prepare Actionable Report?
Lets assume we have the following data available for an ecommerce company −
| Country | USA | UK | Canada | Australia | China | India |
|---|---|---|---|---|---|---|
| Product sale | 200 | 100 | 135 | 120 | 160 | 155 |
Budget Spent
| Country | USA | UK | Canada | Australia | China | India |
|---|---|---|---|---|---|---|
| Budget Spent in $ | 10K | 9K | 8K | 9k | 8K | 5K |
Actionable Points
Highest revenue generating country is USA, increase the budget for the USA.
India has high potential. If we double the budget, then we can make good revenue (from India).
China is doing well. We can increase the budget for China too.
UK is not up to the mark, so stop spending money there or find new techniques to improve sales.
Canada and Australia need improvement. Try for the next segment. If you find the same data in the next segment, then stop spending money there too.
Web Analytics - Terminology
We have listed here a set of terms that one should be familiar with while performing web analytics −
Benchmarking − A service that gives a view of how your website is performing in contrast to others.
Bounce Rate − Number of times a user quits without exploring your webpages.
Click − An action of clicking on your webpages.
Conversion − Conversion takes place when a goal is completed, e.g., purchase, registration, downloads, etc.
Direct Traffic − Traffic coming directly on your website by clicking on your websites link or typing the URL of your website in the address bar.
Filter − A guideline that exclude/include specific data from reports.
Funnels − Steps visitors take to finally complete a goal.
Goal − A metric that defines the success rate, e.g., sale or sign-up.
Goal Conversion Rate − Percentage of visits on every goal achieved.
Impression − The display of your website on the Internet.
Keywords − Search queries that visitors use to find your website.
Landing Page − The first page from where a visitor enters your website.
New Visitor − The visitor who is coming to your website for the first time.
Organic Traffic − Traffic for which you need not pay. It comes naturally, e.g., traffic from search engines.
Paid Traffic − Traffic for which you need to pay, e.g., Google AdWords.
Page View − Number of times a page is viewed.
Returning Visitor − The visitors who have already visited your page earlier. Returning visitors are an asset for any website.
Time on Site − The average time a visitor spends accessing your site in a time.
Tracking Code − A small snippet of code inserted into the body of HTML page. This code captures the information about visits to a page.
Traffic − Flow of visitors to your website.
Traffic Sources − The source from where traffic originates.
