- Web Analytics - Home
- Web Analytics - Introduction
- Web Analytics - Google Analytics
- Web Analytics - Optimizely
- Web Analytics - Kissmetrics
- Web Analytics - Crazy Egg
- Web Analytics - Key Metrics
- Web Analytics - Data Sources
- Web Analytics - Segmentation
- Web Analytics - Dashboards
- Web Analytics - Conversion
- Web Analytics - Emerging Analytics
- Web Analytics - A/B Testing
- Automated Reporting & Annotation
- Actionable Reporting
- Analytics Terminology
Web Analytics - Google Analytics
Analytics Tools offer an insight into the performance of your website, visitors behavior, and data flow. These tools are inexpensive and easy to use. Sometimes, they are even free.
Google Analytics
Google Analytics is a freemium analytic tool that provides a detailed statistics of the web traffic. It is used by more than 60% of website owners.
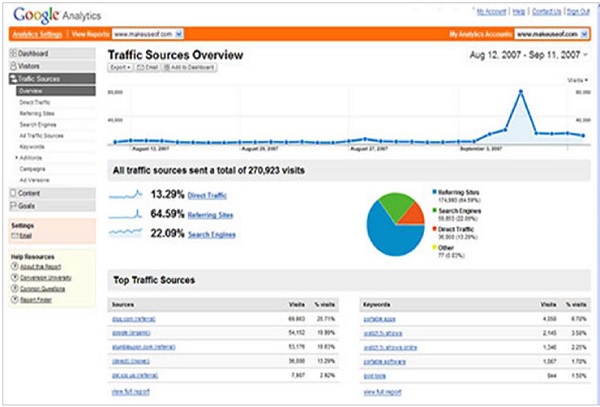
Google analytics helps you to track and measure visitors, traffic sources, goals, conversion, and other metrics (as shown in the above image). It basically generates reports on −
- Audience Analysis
- Acquisition Analysis
- Behavior Analysis
- Conversion Analysis
Let us discuss each one of them in detail.
Audience Analysis
As the name suggests, audience analysis gives you an overview of the audience who visit your site along with their session history, page-views, bounce rate, etc. You can trace the new as well as the returning users along with their geographical locations. You can track −
The age and gender of your audience under Demographics.
The affinity reach and market segmentation under Interests.
Language and location under Geo.
New and returning visitors, their frequency, and engagement under Behavior.
Browsers, Operating systems, and network of your audience in Technology.
Mobile device info under Mobile.
Custom variable report under Custom. This report shows the activity by custom modules that you created to capture the selections.
Benchmarking channels, locations, and devices under Benchmarking. Benchmarking allows you to compare your metrics with other related industries. So, you can plot what you need to incur in order to overtake the market.
Flow of user activity under Users flow to see the path they took on your website.
Acquisition Analysis
Acquisition means to acquire. Acquisition analysis is carried out to find out the sources from where your web traffic originates. Using acquisition analysis, you can −
Capture traffic from all channels, particular source/medium, and from referrals.
Trace traffic from AdWords (paid search).
See traffic from search engines. Here, you can see Queries, triggered landing pages, and geographical summary.
Track social media traffic. It helps you to identify networks where your users are engaged. You can see referrals from where your traffic originates. You can also have a view of your hub activity, bookmarking sites follow-up, etc. In the same tab, you can have a look at your endorsements in details. It helps you measure the impact of social media on your website.
See which plug-ins gave you traffic.
Have a look at all the campaigns you built throughout your website with detailed statistics of paid/organic keywords and the cost incurred on it.
Behavior Analysis
Behavior analysis monitors users activities on a website. You can find behavioral data under the following four segments −
Site Content − It shows how many pages were viewed. You can see the detailed interaction of data across all pages or in segments like content drill-down, landing pages, and exit pages. Content drill-down is breaking up of data into sub-folders. Landing page is the page where the user lands, and exit page is where the user exits your site. You can measure the behavioral flow in terms of content.
Site Speed − Here, you can capture page load time, execution speed, and performance data. You can see how quickly the browser can parse through the page. Further, you can measure page timings, user timings, and get speed suggestion. It helps you to know where you are lagging.
Site Search − It gives you a full picture of how the users search across your site, what they normally look for, and how they arrive at a particular landing page. You can analyze what they search for before landing on your website.
Events − Events are visitors actions with content, which can be traced independently. Example − downloads, sign up, log-in, etc.
Conversion Analysis
Conversion is a goal completion or a transaction by a user on your website. For example, download, checkout, buy, etc. To track conversions in analytics, you need to define a goal and set a URL that is traceable.
Goals − Metrics that measure a profitable activity that you want the user to complete. You can set them to track the actions. Each time a goal is achieved, a conversion is added to your data. You can observe goal completion, value, reverse path, and goal flow.
Ecommerce − You can set ecommerce tracking to know what the users buy from your website. It helps you to find product performance, sale performance, transactions, and purchase time. Based on these data, you can analyze what can be beneficial and what can incur you loss.
Multi-channel funnels − Multi-channel funnels or MCF reports the source of conversion; what roles the website plays, referrals role in that conversion; and what all slabs did when users pass through landing page to conversion. For example, a user searched for a query on Google search page, he visited the website, but did not convert. Later on, he directly typed your website name and made a purchase. All these activities can be traced on MCF.
Attribution − Attribution modeling credits sales and conversions to touch points in conversion tracking. It lets you decide what platforms or strategy or module is the best for your business. Suppose a person visited your website through AdWords ad and made no purchase. A month later, he visits via a social platform and again does not buy. Third time, he visited directly and converted. Here, the last interaction model will credit direct for the conversion, whereas first interaction model will assign credit to paid medium. This way, you can analyze what module should be credited for a conversion.
