
 Data Structure
 Networking
 RDBMS
RDBMS Operating System
 Java
Java MS Excel
 iOS
iOS HTML
HTML CSS
CSS Android
 Python
 C Programming
 C++
C++ C#
C# MongoDB
 MySQL
MySQL Javascript
 PHP
PHP
- Selected Reading
- UPSC IAS Exams Notes
- Developer's Best Practices
- Questions and Answers
- Effective Resume Writing
- HR Interview Questions
- Computer Glossary
- Who is Who
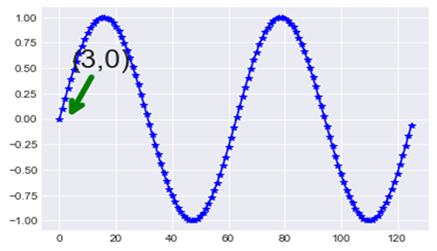
How to add annotations in Matplotlib Plots?
To specify the details of a plot, we use annotations. To create annotations in Matplotlib Plots, we can use the ‘annotate’ method.
Example
import matplotlib.pyplot as plt
import numpy as np
#Let us create a plot and use annotation at the point (5,3),
   x = np.arange(0,4*np.pi,0.1)
plt.plot(np.sin(x), 'b-*')
a = plt.annotate("(3,0)", xy=(3, 0), xycoords='data',
   xytext=(4.0,0.5), textcoords='data',
   arrowprops=dict(arrowstyle="->", color="green", lw=5,
   connectionstyle=("arc3,rad=0.")))
plt.setp(a, size=25)
#Display the plot
plt.show()
Output

Updated on: 2021-02-23T14:50:37+05:30
471 Views

Advertisements