 Data Structure
 Networking
 RDBMS
RDBMS Operating System
 Java
Java MS Excel
 iOS
iOS HTML
HTML CSS
CSS Android
 Python
 C Programming
 C++
C++ C#
C# MongoDB
 MySQL
MySQL Javascript
 PHP
PHP
- Selected Reading
- UPSC IAS Exams Notes
- Developer's Best Practices
- Questions and Answers
- Effective Resume Writing
- HR Interview Questions
- Computer Glossary
- Who is Who
Parkinson Disease Prediction using Machine Learning in Python
Parkinson's Disease is a neurodegenerative disorder that affects millions worldwide, early and accurate diagnosis is crucial for effective treatment which can easily be done using machine learning in Python.
This article explores the application of machine learning techniques in predicting Parkinson's Disease using a dataset from the UCI machine learning repository. By employing the Random Forest Classifier algorithm, we demonstrate how Python can be leveraged to analyze and preprocess data, train a predictive model, and make accurate predictions.
Parkinson Disease Prediction using Machine Learning in Python
We have used Jupyter notebook to run the code in this article.
Below are the steps that we will follow for Parkinson Disease Prediction using Machine Learning in Python ?
Step 1:Import necessary libraries
Example
import pandas as pd
import numpy as np
import matplotlib.pyplot as plt
from sklearn.metrics import accuracy_score, confusion_matrix
from sklearn.preprocessing import StandardScaler
from sklearn.decomposition import PCA
from sklearn.model_selection import train_test_split
from sklearn.ensemble import RandomForestClassifier
Step 2: Load the Parkinson's Disease dataset
The program reads the dataset from the 'parkinsons.csv' file using the pd.read_csv() function and stores it in the data variable.
Example
# Load the Parkinson's Disease dataset
data = pd.read_csv('parkinsons.csv')
Step 3: Data cleaning
The program below removes the 'name' column from the dataset using the drop() function and assigns the modified dataset back to the data variable.
Example
# Data cleaning
data = data.drop('name', axis=1)  # Remove the 'name' column
Step 4: Data preprocessing
The program below separates the features (X) from the target variable (y) using the drop() function and assigns them to the respective variables.
Example
# Data preprocessing
X = data.drop('status', axis=1)  # Features
y = data['status']  # Target variable
Step 5: Data analysis
The program below provides information about the dataset ?
The shape of the dataset (number of rows and columns) is printed using data.shape.
The number of samples with Parkinson's Disease and healthy samples is displayed using len(data[data['status'] == 1]) and len(data[data['status'] == 0]), respectively.
A summary of the dataset is printed using data.describe().
Example
print("Data Shape:", data.shape)
print("Parkinson's Disease Samples:", len(data[data['status'] == 1]))
print("Healthy Samples:", len(data[data['status'] == 0]))
print("\nData Summary:")
print(data.describe())
Output
Data Shape: (195, 23)
Parkinson's Disease Samples: 147
Healthy Samples: 48

Data Summary:
       MDVP:Fo(Hz)  MDVP:Fhi(Hz)  MDVP:Flo(Hz)  MDVP:Jitter(%)  \
count   195.000000    195.000000    195.000000      195.000000
mean    154.228641    197.104918    116.324631        0.006220
std      41.390065     91.491548     43.521413        0.004848
min      88.333000    102.145000     65.476000        0.001680
25%     117.572000    134.862500     84.291000        0.003460
50%     148.790000    175.829000    104.315000        0.004940
75%     182.769000    224.205500    140.018500        0.007365
max     260.105000    592.030000    239.170000        0.033160

       MDVP:Jitter(Abs)    MDVP:RAP    MDVP:PPQ  Jitter:DDP  MDVP:Shimmer  \
count        195.000000  195.000000  195.000000  195.000000    195.000000
mean           0.000044    0.003306    0.003446    0.009920      0.029709
std            0.000035    0.002968    0.002759    0.008903      0.018857
min            0.000007    0.000680    0.000920    0.002040      0.009540
25%            0.000020    0.001660    0.001860    0.004985      0.016505
50%            0.000030    0.002500    0.002690    0.007490      0.022970
75%            0.000060    0.003835    0.003955    0.011505      0.037885
max            0.000260    0.021440    0.019580    0.064330      0.119080


max      0.685151    0.825288   -2.434031    0.450493    3.671155    0.527367

[8 rows x 23 columns]
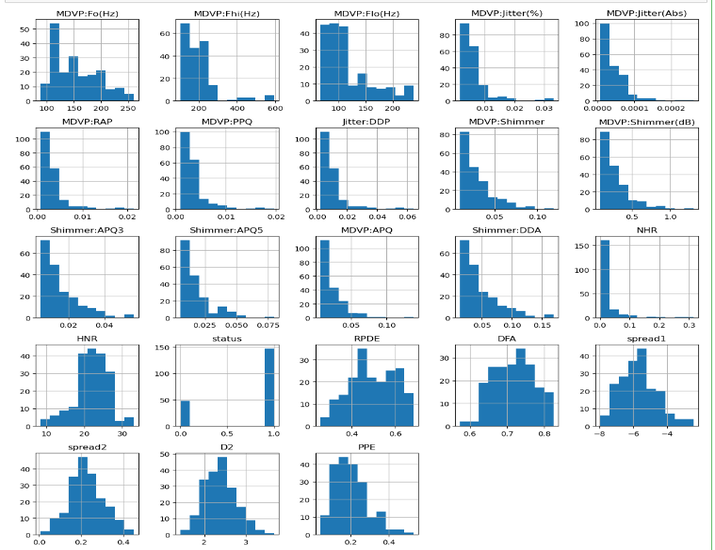
Step 6: Data visualization
The histograms are shown using plt.show().
Example
# Data visualization
data.hist(figsize=(12, 12))
plt.tight_layout()
plt.show()
Output

Step 7:Data scaling
The below program scales the features using StandardScaler(), which standardizes the features by subtracting the mean and scaling to unit variance. The scaled features are stored in the X_scaled variable.
Example
scaler = StandardScaler()
X_scaled = scaler.fit_transform(X)
Step 8: Dimensionality reduction
It reduces the features to two principal components using PCA(n_components=2). The reduced features are stored in the X_pca variable.
Example
pca = PCA(n_components=2)
X_pca = pca.fit_transform(X_scaled)
Step 9: Split the dataset into training and testing sets
The program below splits the dataset into training and testing sets using train_test_split().
Example
X_train, X_test, y_train, y_test = train_test_split(X_scaled, y, test_size=0.2, random_state=42)
Step 10: Create a Classifier known as Random Forest Classifier
The program below creates an instance of the Random Forest Classifier using RandomForestClassifier().
Train the model
Example
rf_classifier = RandomForestClassifier()

# Train the model
rf_classifier.fit(X_train, y_train)
Output
RandomForestClassifier()
Step 11: Make predictions on the test set
Calculate the accuracy of the model
Example
# Make predictions on the test set
y_pred = rf_classifier.predict(X_test)

accuracy = accuracy_score(y_test, y_pred)
print("\nAccuracy:", accuracy)
Output
Accuracy: 0.9230769230769231
The program calculates the accuracy of the model by comparing the predicted labels (y_pred) with the actual labels (y_test).
Step 12: Confusion matrix
It uses the confusion_matrix() function from sklearn.metrics and assigns the confusion matrix to the cm variable.
Example
cm = confusion_matrix(y_test, y_pred)
print("\nConfusion Matrix:")
print(cm)
Output
Confusion Matrix:
[[ 5  2]
 [ 1 31]]
Conclusion
In conclusion, this article presented a machine learning approach for Parkinson's Disease prediction using Python. By utilizing the Random Forest Classifier algorithm and a comprehensive dataset, we demonstrated the effectiveness of machine learning in accurately predicting the presence of Parkinson's Disease.
The results highlight the potential of this approach in assisting healthcare professionals with early diagnosis and intervention, leading to improved patient outcomes.

