
 Data Structure
 Networking
 RDBMS
RDBMS Operating System
 Java
Java MS Excel
 iOS
iOS HTML
HTML CSS
CSS Android
 Python
 C Programming
 C++
C++ C#
C# MongoDB
 MySQL
MySQL Javascript
 PHP
PHP
- Selected Reading
- UPSC IAS Exams Notes
- Developer's Best Practices
- Questions and Answers
- Effective Resume Writing
- HR Interview Questions
- Computer Glossary
- Who is Who
Medical Insurance Price Prediction using Machine Learning in Python
Like in many other sectors, predictive analysis is quite helpful in the finance and insurance sector as well. Using this machine learning technique, we can find out useful information about any insurance policy and therefore save huge sums of money. Here, we will be using this approach of predictive analysis for a medical insurance dataset.
The problem statement here is that we have a dataset of some people with certain attributes. Using machine learning in Python, we have to find out relevant information from this dataset and also have to predict the insurance price a person will have to pay.
Algorithm
Step 1 ? Import the libraries like numpy, pandas, matplotlib, seaborn and sklearn, etc and load the dataset as pandas data frame.
Step 2 ? For cleaning the data, first check for null values. If null values are found then look for the relationship between the various features and impute the null values. If not, then we are good to go.
Step 3 ? Now perform EDA, meaning check for relationship between various independent variables.
Step 4 ? Find outliers and adjust them.
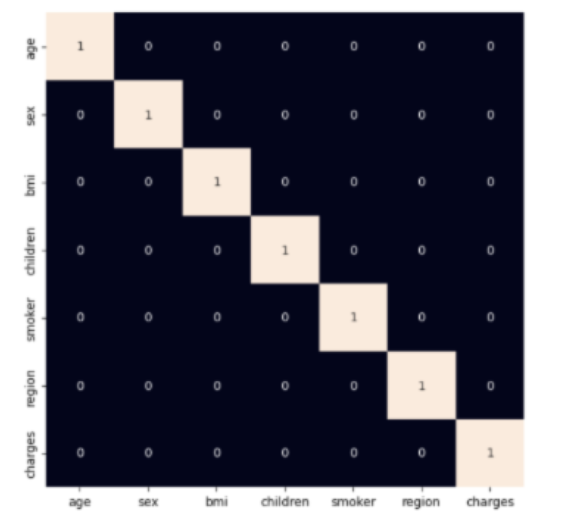
Step 5 ? Plot a heatmap to find out the highly correlated variables.
Step 6 ? Split the dataset into the test and train set and normalize the data using StandardScaler.
Step 7 ? Now train some machine learning models on this data and use mape to check which model works the best.
Example
In this example, we will take a medical insurance dataset that you can find here and then, we will perform the various steps required to predict the price of insurance a person will have to pay for a certain medical insurance.
#import the required libraries
import numpy as np
import pandas as pd
import seaborn as sb
import matplotlib.pyplot as plt

from sklearn.model_selection import train_test_split
from sklearn.preprocessing import StandardScaler, LabelEncoder
from sklearn.metrics import mean_absolute_percentage_error as mape
from sklearn.linear_model import LinearRegression, Lasso, Ridge
from xgboost import XGBRegressor
from sklearn.ensemble import RandomForestRegressor, AdaBoostRegressor

import warnings
warnings.filterwarnings('ignore')

#load and print the dataset
df = pd.read_csv('insurance_dataset.csv')
df.head()
df.shape
df.info()
df.describe()

#check for null values
df.isnull().sum()

#see the relation between independent features
#pie charts
features = ['sex', 'smoker', 'region']

plt.subplots(figsize=(20, 10))
for i, col in enumerate(features):
    plt.subplot(1, 3, i + 1)

    x = df[col].value_counts()
    plt.pie(x.values, labels=x.index, autopct='%1.1f%%')

plt.show()

#bar graphs
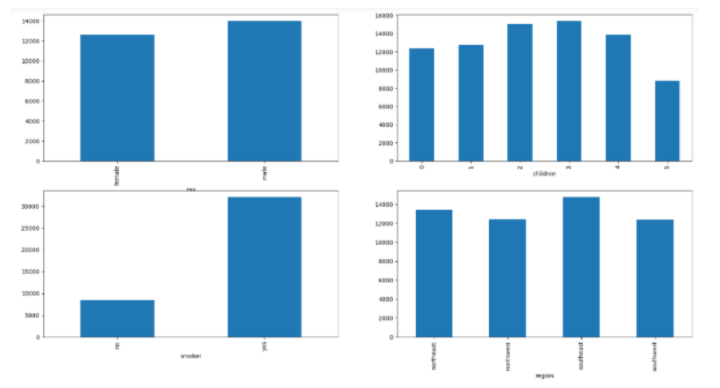
features = ['sex', 'children', 'smoker', 'region']

plt.subplots(figsize=(20, 10))
for i, col in enumerate(features):
    plt.subplot(2, 2, i + 1)
    df.groupby(col).mean()['charges'].plot.bar()
plt.show()

#plots
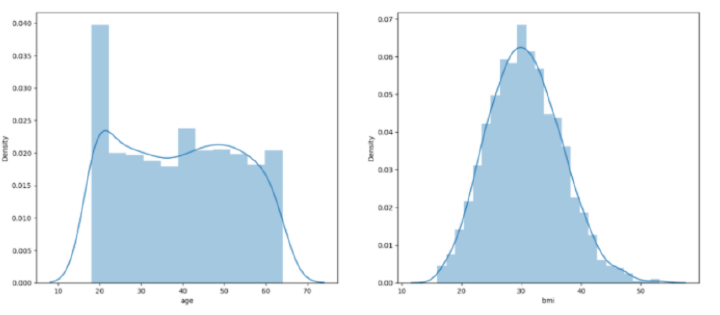
features = ['age', 'bmi']

plt.subplots(figsize=(17, 7))
for i, col in enumerate(features):
    plt.subplot(1, 2, i + 1)
    sb.distplot(df[col])
plt.show()

#scatterplots
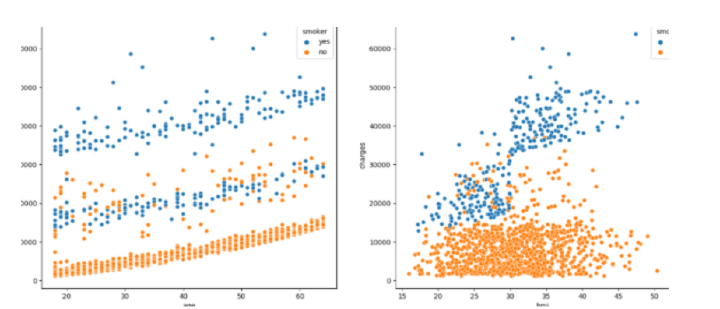
features = ['age', 'bmi']

plt.subplots(figsize=(17, 7))
for i, col in enumerate(features):
    plt.subplot(1, 2, i + 1)
    sb.scatterplot(data=df, x=col, y='charges', hue='smoker')
plt.show()

#check for outliers
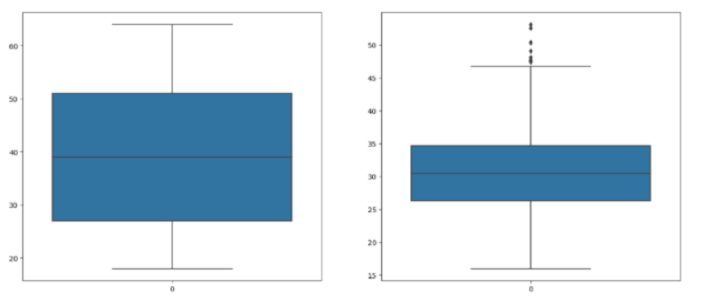
features = ['age', 'bmi']

plt.subplots(figsize=(17, 7))
for i, col in enumerate(features):
    plt.subplot(1, 2, i + 1)
    sb.boxplot(df[col])
plt.show()

#adjust the outliers
df.shape, df[df['bmi']<45].shape
df = df[df['bmi']<50]
for col in df.columns:
    if df[col].dtype == object:
        le = LabelEncoder()
        df[col] = le.fit_transform(df[col])

#use heatmap to see highly correlated variables
plt.figure(figsize=(7, 7))
sb.heatmap(df.corr() > 0.8, annot=True, cbar=False)
plt.show()

#split the dataset into train and test sets
features = df.drop(['charges'], axis=1)
target = df['charges']

X_train, X_val,\
    Y_train, Y_val = train_test_split(features, target, test_size=0.1, random_state=22)

X_train.shape, X_val.shape

#fit the data
scaler = StandardScaler()
X_train = scaler.fit_transform(X_train)
X_val = scaler.transform(X_val)

#find the performance of various models
models = [LinearRegression(), XGBRegressor(),
          RandomForestRegressor(), AdaBoostRegressor(),
          Lasso(), Ridge()]

for i in range(6):
    models[i].fit(X_train, Y_train)

    print(f'{models[i]} : ')
    pred_train = models[i].predict(X_train)
    print('Training Error : ', mape(Y_train, pred_train))

    pred_val = models[i].predict(X_val)
    print('Validation Error : ', mape(Y_val, pred_val))
    print()
After importing the required libraries, the dataset is stored into a python dataframe. The code then checks for null values in the dataset and pie charts and bar graphs are plotted accordingly to visualize the distribution and proportions of sex, region and smoker columns in the dataset.
Then, histograms and scatterplots are displayed to visualize the distribution and relationship of age and bmi with charges variable. Age and bmi columns are checked and modifications are made by filtering out extreme values. After which, the values in the columns: sex, smoker and region are converted to numerical form and a heatmap is created to visualise the relation between the columns in the dataset.
The dataset is then split into training and validation sets. Various regression models are trained and evaluated based on the mean absolute percentage error on both training and validation sets.
Output
<class 'pandas.core.frame.DataFrame'>
RangeIndex: 1338 entries, 0 to 1337
Data columns (total 7 columns):
 #   Column    Non-Null Count  Dtype
---  ------    --------------  -----
 0   age       1338 non-null   int64
 1   sex       1338 non-null   object
 2   bmi       1338 non-null   float64
 3   children  1338 non-null   int64
 4   smoker    1338 non-null   object
 5   region    1338 non-null   object
 6   charges   1338 non-null   float64
dtypes: float64(2), int64(2), object(3)
memory usage: 73.3+ KB

LinearRegression() ?
Training Error :  0.42160312973300035
Validation Error :  0.36819643775368394
XGBRegressor() ?
Training Error :  0.07414118093426757
Validation Error :  0.43487251393507226
RandomForestRegressor() ?
Training Error :  0.11931475932482996
Validation Error :  0.33574049059141486
AdaBoostRegressor() ?
Training Error :  0.6166709629183661
Validation Error :  0.5758503954769271
Lasso() ?
Training Error :  0.42160217445355996
Validation Error :  0.36821456297631355
Ridge() ?
Training Error :  0.42182509871430085
Validation Error :  0.3685041955294438
You can see that XGBRegressor gives the least value of MAPE(mean absolute percentage error). This means that this model is predicting prices quite close to the actual prices and thus, can be regarded as the best model for this project.
Conclusion
For doing this medical insurance price prediction, you can also use any other model like K-nearest neighbors (KNN), Support Vector machine (SVM), Random Forest (RF) and Naive Bayes etc. Also, here the data was mostly preprocessed. However, you can preprocess it on your own as required. Moreover, similar predictions can be made for datasets with several other features as well in the same manner.

