- OpenCV Python - Home
- OpenCV Python - Overview
- OpenCV Python - Environment
- OpenCV Python - Reading Image
- OpenCV Python - Write Image
- OpenCV Python - Using Matplotlib
- OpenCV Python - Image Properties
- OpenCV Python - Bitwise Operations
- OpenCV Python - Shapes and Text
- OpenCV Python - Mouse Events
- OpenCV Python - Add Trackbar
- OpenCV Python - Resize and Rotate
- OpenCV Python - Image Threshold
- OpenCV Python - Image Filtering
- OpenCV Python - Edge Detection
- OpenCV Python - Histogram
- OpenCV Python - Color Spaces
- OpenCV Python - Transformations
- OpenCV Python - Image Contours
- OpenCV Python - Template Matching
- OpenCV Python - Image Pyramids
- OpenCV Python - Image Addition
- OpenCV Python - Image Blending
- OpenCV Python - Fourier Transform
- OpenCV Python - Capture Videos
- OpenCV Python - Play Videos
- OpenCV Python - Images From Video
- OpenCV Python - Video from Images
- OpenCV Python - Face Detection
- OpenCV Python - Meanshift/Camshift
- OpenCV Python - Feature Detection
- OpenCV Python - Feature Matching
- OpenCV Python - Digit Recognition
- OpenCV Python Resources
- OpenCV Python - Quick Guide
- OpenCV Python - Resources
- OpenCV Python - Discussion
OpenCV Python - Image Threshold
In digital image processing, the thresholding is a process of creating a binary image based on a threshold value of pixel intensity. Thresholding process separates the foreground pixels from background pixels.
OpenCV provides functions to perform simple, adaptive and Otsus thresholding.
In simple thresholding, all pixels with value less than threshold are set to zero, rest to the maximum pixel value. This is the simplest form of thresholding.
The cv2.threshold() function has the following definition.
cv2.threshold((src, thresh, maxval, type, dst)
Parameters
The parameters for the image thresholding are as follows −
- Src: Input array.
- Dst: Output array of same size.
- Thresh: Threshold value.
- Maxval: Maximum value.
- Type: Thresholding type.
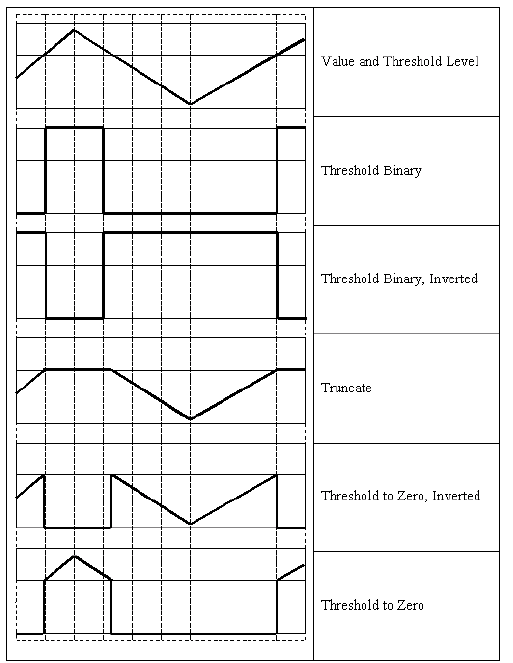
Types of Thresholding
Other types of thresholding are enumerated as below −
| Sr.No | Type & Function |
|---|---|
| 1 | cv.THRESH_BINARY dst(x,y) = maxval if src(x,y)>thresh 0 otherwise |
| 2 | cv.THRESH_BINARY_INV dst(x,y)=0 if src(x,y)>thresh maxval otherwise |
| 3 | cv.THRESH_TRUNC dst(x,y)=threshold if src(x,y)>thresh src(x,y) otherwise |
| 4 | cv.THRESH_TOZERO dst(x,y)=src(x,y) if src(x,y)>thresh 0 otherwise |
| 5 | cv.THRESH_TOZERO_INV dst(x,y)=0 if src(x,y)>thresh src(x,y)otherwise |
These threshold types result in operation on input image according to following diagram −
The threshold() function returns threshold used and threshold image.
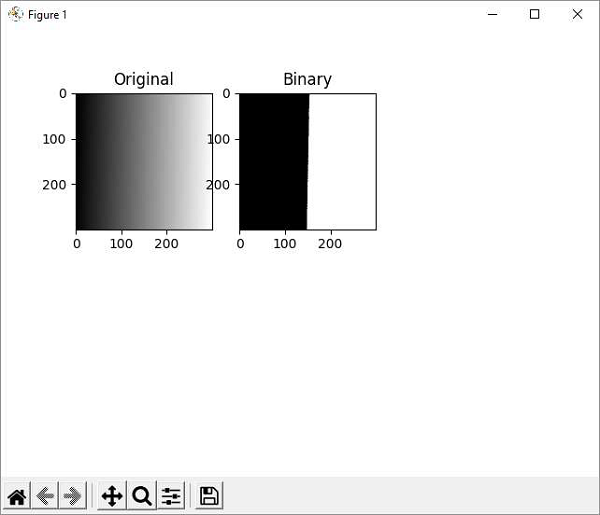
Following program produces a binary image from the original with a gradient of grey values from 255 to 0 by setting a threshold to 127.
Example
Original and resultant threshold binary images are plotted side by side using Matplotlib library.
import cv2 as cv
import numpy as np
from matplotlib import pyplot as plt
img = cv.imread('gradient.png',0)
ret,img1 = cv.threshold(img,127,255,cv.THRESH_BINARY)

plt.subplot(2,3,1),plt.imshow(img,'gray',vmin=0,vmax=255)
plt.title('Original')
plt.subplot(2,3,2),plt.imshow(img1,'gray',vmin=0,vmax=255)
plt.title('Binary')
plt.show()
Output
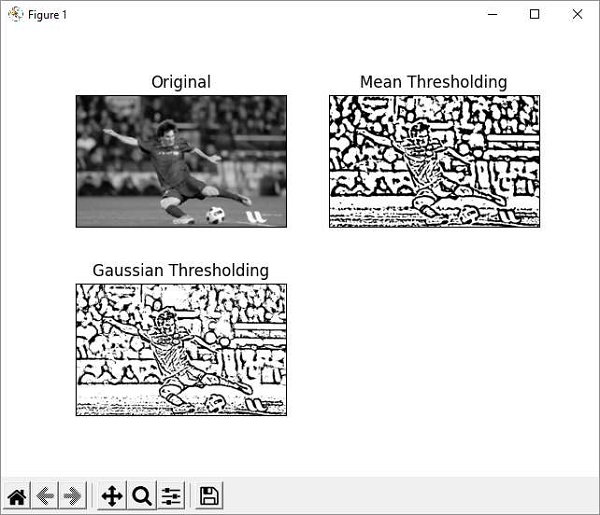
The adaptive thresholding determines the threshold for a pixel based on a small region around it. So, different thresholds for different regions of the same image are obtained. This gives better results for images with varying illumination.
The cv2.adaptiveThreshold() method takes following input arguments −
cv.adaptiveThreshold( src, maxValue, adaptiveMethod, thresholdType, blockSize, C[, dst] )
The adaptiveMethod has following enumerated values −
cv.ADAPTIVE_THRESH_MEAN_C − The threshold value is the mean of the neighbourhood area minus the constant C.
cv.ADAPTIVE_THRESH_GAUSSIAN_C − The threshold value is a Gaussianweighted sum of the neighbourhood values minus the constant C.
Example
In the example below, the original image (messi.jpg is applied with mean and Gaussian adaptive thresholding.
import cv2 as cv
import numpy as np
from matplotlib import pyplot as plt
img = cv.imread('messi.jpg',0)
img = cv.medianBlur(img,5)
th1 = cv.adaptiveThreshold(img,255,cv.ADAPTIVE_THRESH_MEAN_C,\
   cv.THRESH_BINARY,11,2)
th2 = cv.adaptiveThreshold(img,255,cv.ADAPTIVE_THRESH_GAUSSIAN_C,\
   cv.THRESH_BINARY,11,2)
titles = ['Original', 'Mean Thresholding', 'Gaussian Thresholding']
images = [img, th1, th2]
for i in range(3):
   plt.subplot(2,2,i+1),plt.imshow(images[i],'gray')
   plt.title(titles[i])
   plt.xticks([]),plt.yticks([])
plt.show()
Output
Original as well as adaptive threshold binary images are plotted by using matplotlib as shown below −
Example
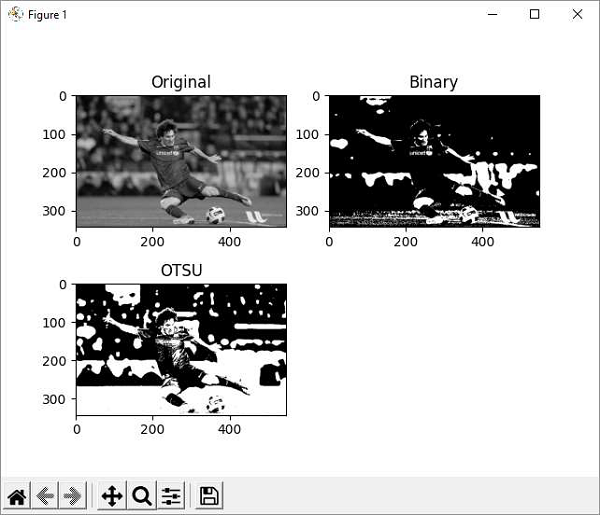
OTSU algorithm determines the threshold value automatically from the image histogram. We need to pass the cv.THRES_OTSU flag in addition to the THRESH-BINARY flag.
import cv2 as cv
import numpy as np
from matplotlib import pyplot as plt
img = cv.imread('messi.jpg',0)
# global thresholding
ret1,img1 = cv.threshold(img,127,255,cv.THRESH_BINARY)
# Otsu's thresholding
ret2,img2 = cv.threshold(img,0,255,cv.THRESH_BINARY+cv.THRESH_OTSU)
plt.subplot(2,2,1),plt.imshow(img,'gray',vmin=0,vmax=255)
plt.title('Original')
plt.subplot(2,2,2),plt.imshow(img1,'gray')

plt.title('Binary')
plt.subplot(2,2,3),plt.imshow(img2,'gray')
plt.title('OTSU')
plt.show()
Output
The matplotlibs plot result is as follows −