- OpenCV Python - Home
- OpenCV Python - Overview
- OpenCV Python - Environment
- OpenCV Python - Reading Image
- OpenCV Python - Write Image
- OpenCV Python - Using Matplotlib
- OpenCV Python - Image Properties
- OpenCV Python - Bitwise Operations
- OpenCV Python - Shapes and Text
- OpenCV Python - Mouse Events
- OpenCV Python - Add Trackbar
- OpenCV Python - Resize and Rotate
- OpenCV Python - Image Threshold
- OpenCV Python - Image Filtering
- OpenCV Python - Edge Detection
- OpenCV Python - Histogram
- OpenCV Python - Color Spaces
- OpenCV Python - Transformations
- OpenCV Python - Image Contours
- OpenCV Python - Template Matching
- OpenCV Python - Image Pyramids
- OpenCV Python - Image Addition
- OpenCV Python - Image Blending
- OpenCV Python - Fourier Transform
- OpenCV Python - Capture Videos
- OpenCV Python - Play Videos
- OpenCV Python - Images From Video
- OpenCV Python - Video from Images
- OpenCV Python - Face Detection
- OpenCV Python - Meanshift/Camshift
- OpenCV Python - Feature Detection
- OpenCV Python - Feature Matching
- OpenCV Python - Digit Recognition
- OpenCV Python Resources
- OpenCV Python - Quick Guide
- OpenCV Python - Resources
- OpenCV Python - Discussion
OpenCV Python - Edge Detection
An edge here means the boundary of an object in the image. OpenCV has a cv2.Canny() function that identifies the edges of various objects in an image by implementing Cannys algorithm.
Canny edge detection algorithm was developed by John Canny. According to it, objects edges are determined by performing following steps −
First step is to reduce the noisy pixels in the image. This is done by applying 5X5 Gaussian Filter.
Second step involves finding the intensity gradient of the image. The smooth image of the first stage is filtered by applying the Sobel operator to obtain first order derivatives in horizontal and vertical directions (Gx and Gy).
The root mean square value gives edge gradient and tan inverse ratio of derivatives gives the direction of edge.
$$\mathrm{Edge \:gradient\:G\:=\:\sqrt{G_x^2+G_y^2}}$$
$$\mathrm{Angle\:\theta\:=\:\tan^{-1}(\frac{G_{y}}{G_{x}})}$$
After getting gradient magnitude and direction, a full scan of the image is done to remove any unwanted pixels which may not constitute the edge.
Next step is to perform hysteresis thresholding by using minval and maxval thresholds. Intensity gradients less than minval and maxval are non-edges so discarded. Those in between are treated as edge points or non-edges based on their connectivity.
All these steps are performed by OpenCVs cv2.Canny() function which needs the input image array and minval and maxval parameters.
Example
Heres the example of canny edge detection. The program for the same is as follows −
import numpy as np
import cv2 as cv
from matplotlib import pyplot as plt
img = cv.imread('lena.jpg', 0)
edges = cv.Canny(img,100,200)
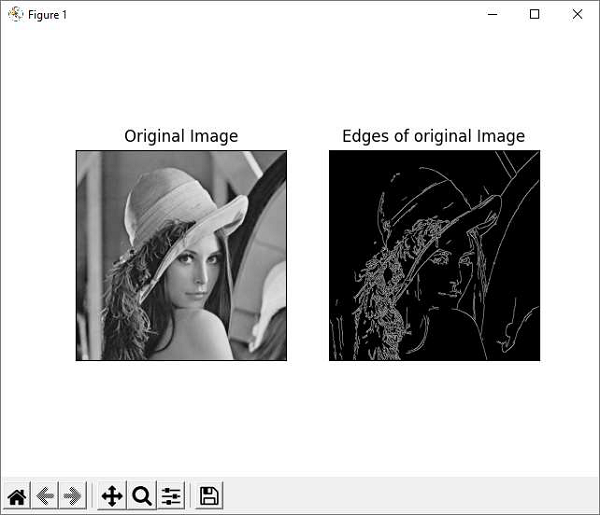
plt.subplot(121),plt.imshow(img,cmap = 'gray')
plt.title('Original Image'), plt.xticks([]), plt.yticks([])
plt.subplot(122),plt.imshow(edges,cmap = 'gray')
plt.title('Edges of original Image'), plt.xticks([]), plt.yticks([])
plt.show()
Output