- Kibana - Home
- Kibana - Overview
- Kibana - Environment Setup
- Kibana - Introduction To Elk Stack
- Kibana - Loading Sample Data
- Kibana - Management
- Kibana - Discover
- Kibana - Aggregation And Metrics
- Kibana - Create Visualization
- Kibana - Working With Charts
- Kibana - Working With Graphs
- Kibana - Working With Heat Map
- Working With Coordinate Map
- Kibana - Working With Region Map
- Working With Guage And Goal
- Kibana - Working With Canvas
- Kibana - Create Dashboard
- Kibana - Timelion
- Kibana - Dev Tools
- Kibana - Monitoring
- Creating Reports Using Kibana
- Kibana Useful Resources
- Kibana - Quick Guide
- Kibana - Useful Resources
- Kibana - Discussion
Kibana - Working With Coordinate Map
Coordinate maps in Kibana will show you the geographic area and mark the area with circles based on aggregation you specify.
Create Index for Coordinate Map
The Bucket aggregation used for coordinate map is geohash aggregation. For this type of aggregation, your index which you are going to use should have a field of type geo point. The geo point is combination of latitude and longitude.
We will create an index using Kibana dev tools and add bulk data to it. We will add mapping and add the geo_point type that we need.
The data that we are going to use is shown here −
{"index":{"_id":1}}
{"location": "2.089330000000046,41.47367000000008", "city": "SantCugat"}
{"index":{"_id":2}}
{"location": "2.2947825000000677,41.601800991000076", "city": "Granollers"}
{"index":{"_id":3}}
{"location": "2.1105957495300474,41.5496295760424", "city": "Sabadell"}
{"index":{"_id":4}}
{"location": "2.132605678083895,41.5370461908878", "city": "Barbera"}
{"index":{"_id":5}}
{"location": "2.151270020052683,41.497779918345415", "city": "Cerdanyola"}
{"index":{"_id":6}}
{"location": "2.1364609496220606,41.371303520399344", "city": "Barcelona"}
{"index":{"_id":7}}
{"location": "2.0819450306711165,41.385491966414705", "city": "Sant Just Desvern"}
{"index":{"_id":8}}
{"location": "2.00532082278266,41.542294286427385", "city": "Rubi"}
{"index":{"_id":9}}
{"location": "1.9560805366930398,41.56142635214226", "city": "Viladecavalls"}
{"index":{"_id":10}}
{"location": "2.09205348251486,41.39327140161001", "city": "Esplugas de Llobregat"}
Now, run the following commands in Kibana Dev Tools as shown below −
PUT /cities
{
"mappings": {
"_doc": {
"properties": {
"location": {
"type": "geo_point"
}
}
}
}
}
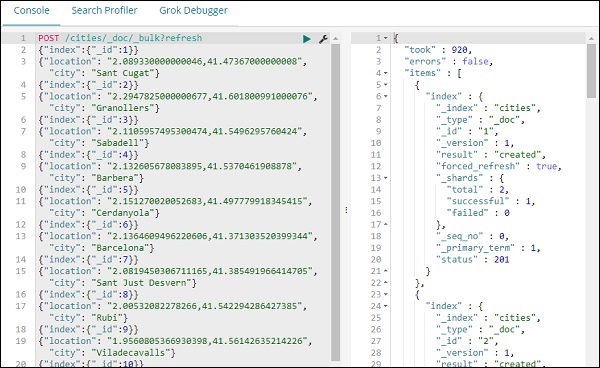
POST /cities/_city/_bulk?refresh
{"index":{"_id":1}}
{"location": "2.089330000000046,41.47367000000008", "city": "SantCugat"}
{"index":{"_id":2}}
{"location": "2.2947825000000677,41.601800991000076", "city": "Granollers"}
{"index":{"_id":3}}
{"location": "2.1105957495300474,41.5496295760424", "city": "Sabadell"}
{"index":{"_id":4}}
{"location": "2.132605678083895,41.5370461908878", "city": "Barbera"}
{"index":{"_id":5}}
{"location": "2.151270020052683,41.497779918345415", "city": "Cerdanyola"}
{"index":{"_id":6}}
{"location": "2.1364609496220606,41.371303520399344", "city": "Barcelona"}
{"index":{"_id":7}}
{"location": "2.0819450306711165,41.385491966414705", "city": "Sant Just Desvern"}
{"index":{"_id":8}}
{"location": "2.00532082278266,41.542294286427385", "city": "Rubi"}
{"index":{"_id":9}}
{"location": "1.9560805366930398,41.56142635214226", "city": "Viladecavalls"}
{"index":{"_id":10}}
{"location": "2.09205348251486,41.3s9327140161001", "city": "Esplugas de Llobregat"}
Now, run the above commands in Kibana dev tools −
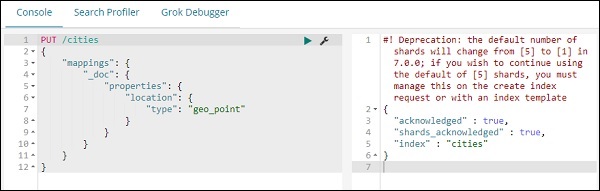
The above will create index name cities of type _doc and the field location is of type geo_point.
Now lets add data to the index: cities −
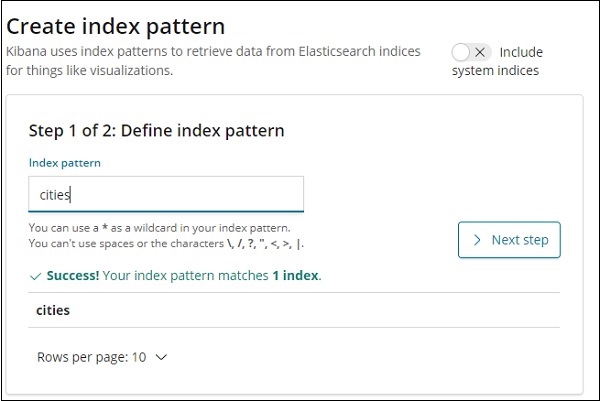
We are done creating index name cites with data. Now let us Create index pattern for cities using Management tab.
The details of fields inside cities index are shown here −
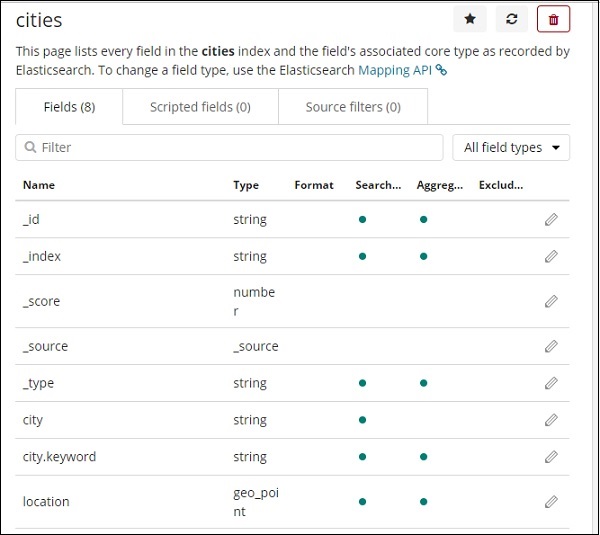
We can see that location is of type geo_point. We can now use it to create visualization.
Getting Started with Coordinate Maps
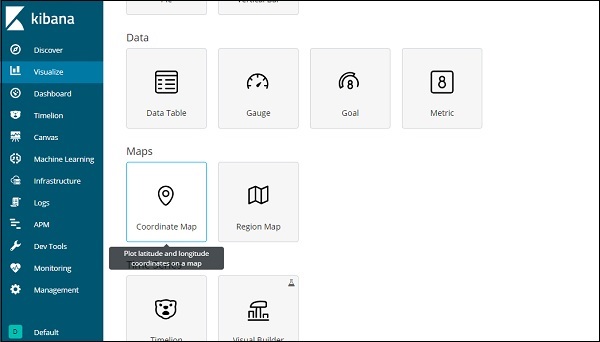
Go to Visualization and select coordinate maps.
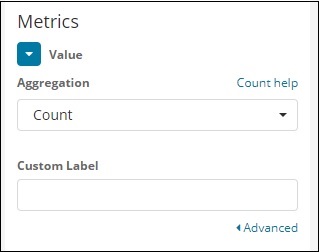
Select the index pattern cities and configure the Aggregation metric and bucket as shown below −
If you click on Analyze button, you can see the following screen −
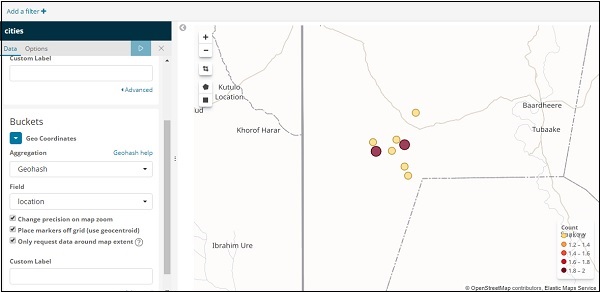
Based on the longitude and latitude, the circles are plotted on the map as shown above.
