- Kibana - Home
- Kibana - Overview
- Kibana - Environment Setup
- Kibana - Introduction To Elk Stack
- Kibana - Loading Sample Data
- Kibana - Management
- Kibana - Discover
- Kibana - Aggregation And Metrics
- Kibana - Create Visualization
- Kibana - Working With Charts
- Kibana - Working With Graphs
- Kibana - Working With Heat Map
- Working With Coordinate Map
- Kibana - Working With Region Map
- Working With Guage And Goal
- Kibana - Working With Canvas
- Kibana - Create Dashboard
- Kibana - Timelion
- Kibana - Dev Tools
- Kibana - Monitoring
- Creating Reports Using Kibana
- Kibana Useful Resources
- Kibana - Quick Guide
- Kibana - Useful Resources
- Kibana - Discussion
Kibana - Working With Canvas
Canvas is yet another powerful feature in Kibana. Using canvas visualization, you can represent your data in different color combination, shapes, text, multipage setup etc.
We need data to show in the canvas. Now, let us load some sample data already available in Kibana.
Loading Sample Data for Canvas Creation
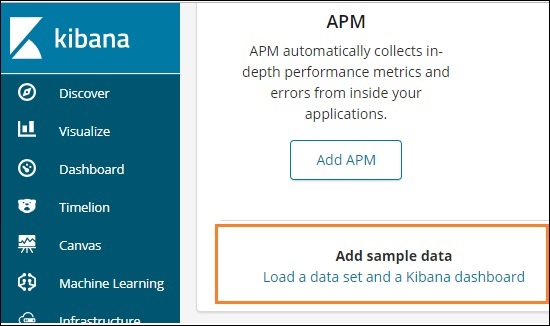
To get the sample data go to Kibana home page and click on Add sample data as shown below −
Click on Load a data set and a Kibana dashboard. It will take you to the screen as shown below −
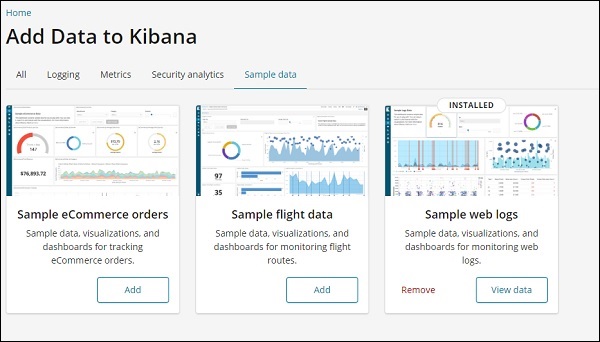
Click on Add button for Sample eCommerce orders. It will take some time to load the sample data. Once done you will get an alert message showing Sample eCommerce data loaded.
Getting Started with Canvas Visualization
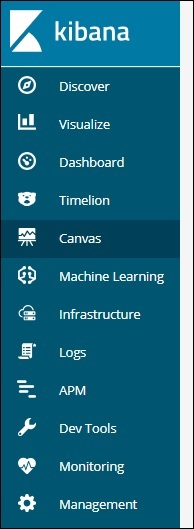
Now go to Canvas Visualization as shown below −
Click on Canvas and it will display screen as shown below −
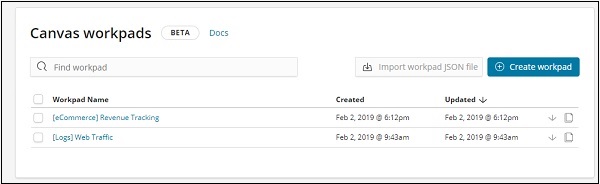
We have eCommerce and Web Traffic sample data added. We can create new workpad or use the existing one.
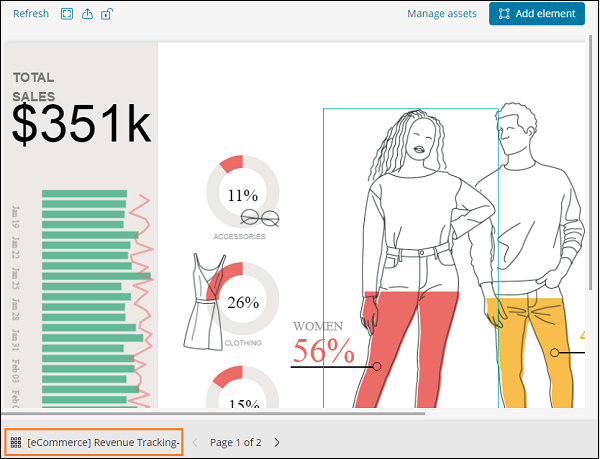
Here, we will select the existing one. Select eCommerce Revenue Tracking Workpad Name and it will display the screen as shown below −
Cloning an Existing Workpad in Canvas
We will clone the workpad so that we can make changes to it. To clone an existing workpad, click on the name of the workpad shown at the bottom left −
Click on the name and select clone option as shown below −
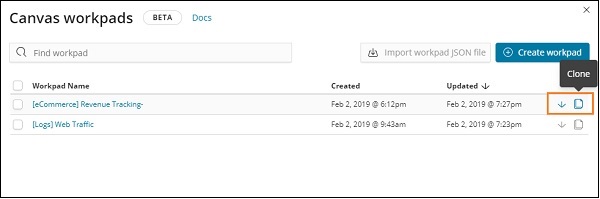
Click on the clone button and it will create a copy of the eCommerce Revenue Tracking workpad. You can find it as shown below −
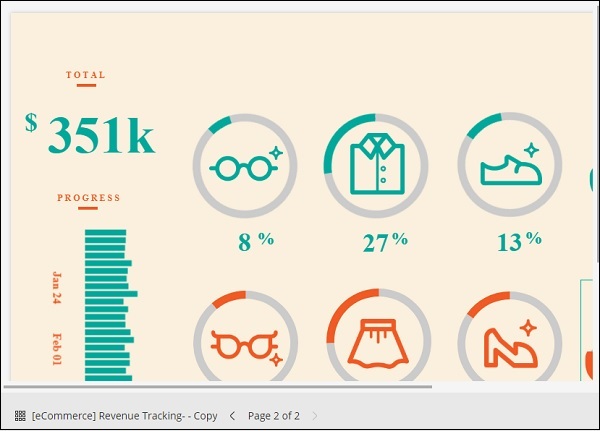
In this section, let us understand how to use the workpad. If you see above workpad, there are 2 pages for it. So in canvas we can represent the data in multiple pages.
The page 2 display is as shown below −
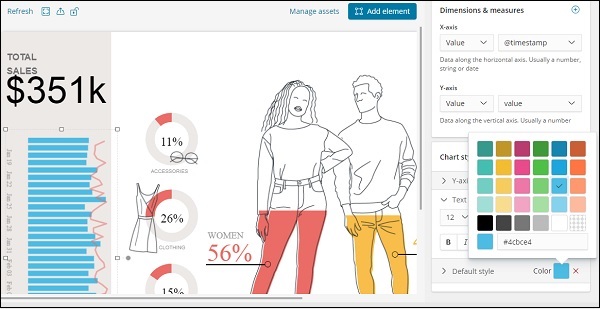
Select Page 1 and click on the Total sales displayed on left side as shown below −
On the right side, you will get the data related to it −
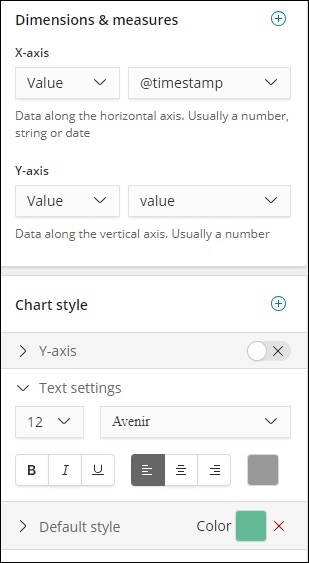
Right now the default style used is green colour. We can change the colour here and check the display of same.
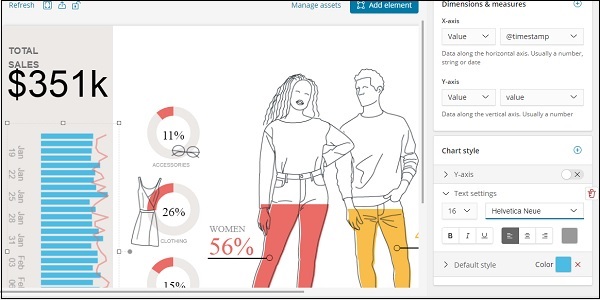
We have also changed the font and size for text settings as shown below −
Adding New Page to Workpad Inside Canvas
To add new page to the workpad, do as shown below −
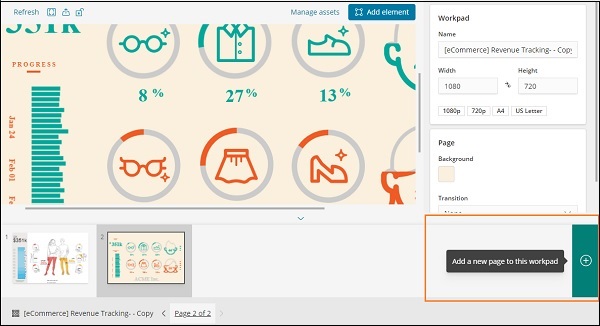
Once the page is created as shown below −
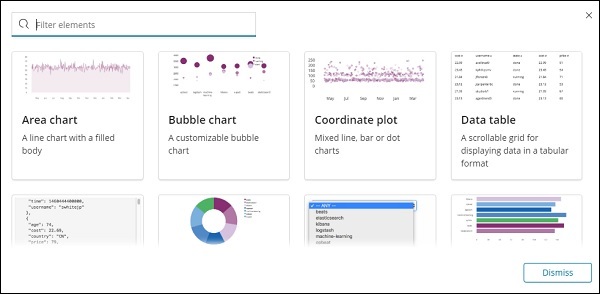
Click on Add element and it will display all possible visualization as shown below −
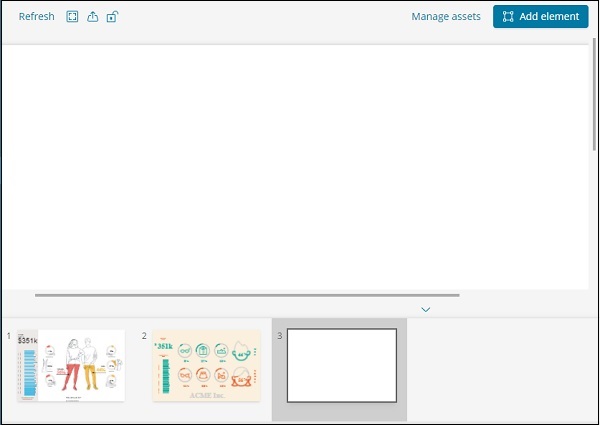
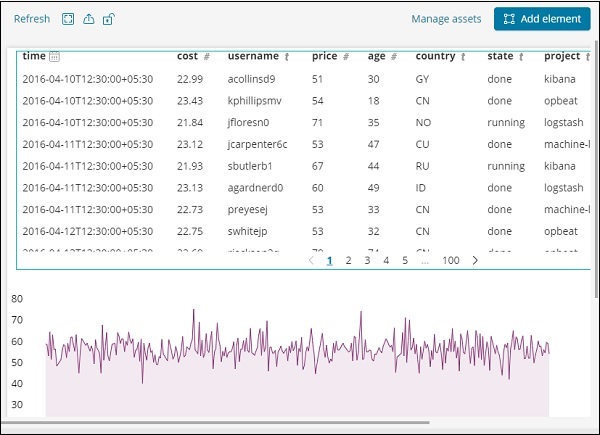
We have added two elements Data table and Area Chart as shown below
You can add more data elements to the same page or add more pages too.
