- Kibana - Home
- Kibana - Overview
- Kibana - Environment Setup
- Kibana - Introduction To Elk Stack
- Kibana - Loading Sample Data
- Kibana - Management
- Kibana - Discover
- Kibana - Aggregation And Metrics
- Kibana - Create Visualization
- Kibana - Working With Charts
- Kibana - Working With Graphs
- Kibana - Working With Heat Map
- Working With Coordinate Map
- Kibana - Working With Region Map
- Working With Guage And Goal
- Kibana - Working With Canvas
- Kibana - Create Dashboard
- Kibana - Timelion
- Kibana - Dev Tools
- Kibana - Monitoring
- Creating Reports Using Kibana
- Kibana Useful Resources
- Kibana - Quick Guide
- Kibana - Useful Resources
- Kibana - Discussion
Selected Reading
Kibana - Monitoring
Kibana Monitoring gives the details about the performance of ELK stack. We can get the details of memory used, response time etc.
Monitoring Details
To get monitoring details in Kibana, click on the monitoring tab as shown below −
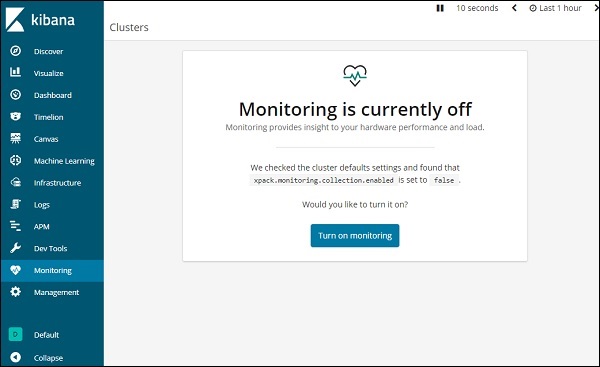
Since we are using the monitoring for the first time, we need to keep it ON. For this, click the button Turn on monitoring as shown above. Here are the details displayed for Elasticsearch −
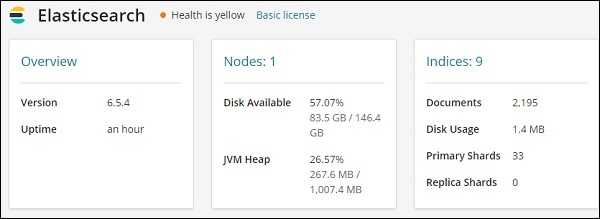
It gives the version of elasticsearch, disk available, indices added to elasticsearch, disk usage etc.
The monitoring details for Kibana are shown here −
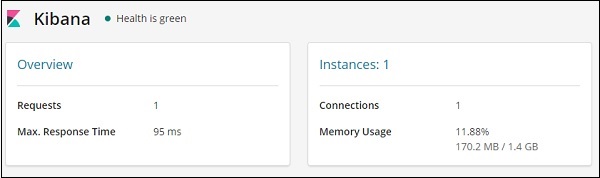
It gives the Requests and max response time for the request and also the instances running and memory usage.

Advertisements