- Kibana - Home
- Kibana - Overview
- Kibana - Environment Setup
- Kibana - Introduction To Elk Stack
- Kibana - Loading Sample Data
- Kibana - Management
- Kibana - Discover
- Kibana - Aggregation And Metrics
- Kibana - Create Visualization
- Kibana - Working With Charts
- Kibana - Working With Graphs
- Kibana - Working With Heat Map
- Working With Coordinate Map
- Kibana - Working With Region Map
- Working With Guage And Goal
- Kibana - Working With Canvas
- Kibana - Create Dashboard
- Kibana - Timelion
- Kibana - Dev Tools
- Kibana - Monitoring
- Creating Reports Using Kibana
- Kibana Useful Resources
- Kibana - Quick Guide
- Kibana - Useful Resources
- Kibana - Discussion
Kibana - Environment Setup
To start working with Kibana we need to install Logstash, Elasticsearch and Kibana. In this chapter, we will try to understand the installation of the ELK stack here.
We would discuss the following installations here −
- Elasticsearch Installation
- Logstash Installation
- Kibana Installation
Elasticsearch Installation
A detailed documentation on Elasticsearch exists in our library. You can check here for elasticsearch installation. You will have to follow the steps mentioned in the tutorial to install Elasticsearch.
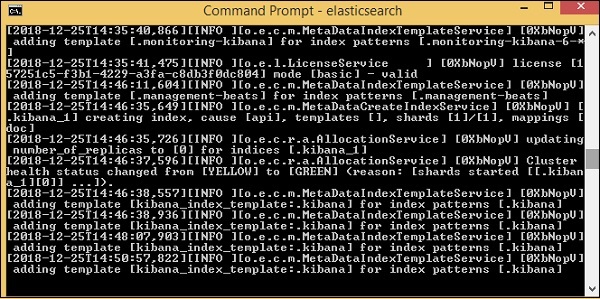
Once done with the installation, start the elasticsearch server as follows −
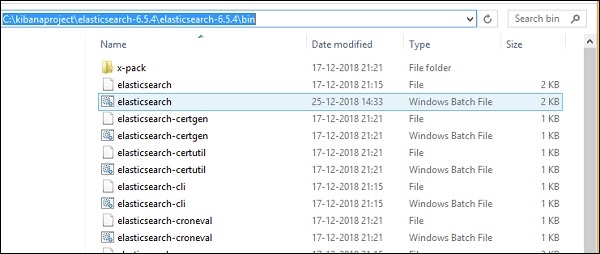
Step 1
For Windows
> cd kibanaproject/elasticsearch-6.5.4/elasticsearch-6.5.4/bin
> elasticsearch
Please note for windows user, the JAVA_HOME variable has to be set to the java jdk path.
For Linux
$ cd kibanaproject/elasticsearch-6.5.4/elasticsearch-6.5.4/bin
$ elasticsearch
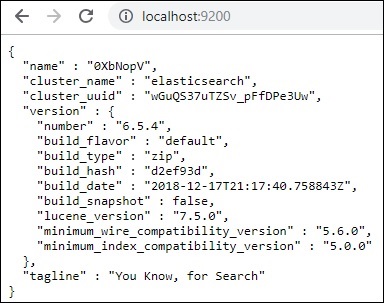
The default port for elasticsearch is 9200. Once done, you can check the elasticsearch at port 9200 on localhost http://localhost:9200/as shown below −
Logstash Installation
For Logstash installation, follow this elasticsearch installation which is already existing in our library.
Kibana Installation
Go to the official Kibana site −https://www.elastic.co/products/kibana
Click the downloads link on the top right corner and it will display screen as follows −
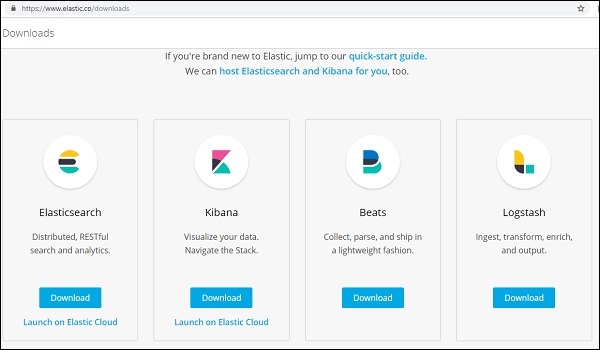
Click the Download button for Kibana. Please note to work with Kibana we need 64 bit machine and it will not work with 32 bit.
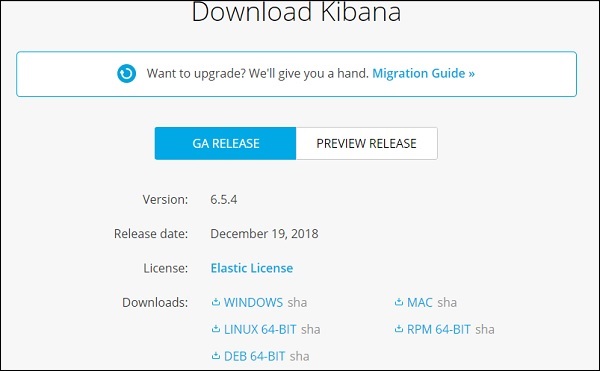
In this tutorial, we are going to use Kibana version 6. The download option is available for Windows, Mac and Linux. You can download as per your choice.
Create a folder and unpack the tar/zip downloads for kibana. We are going to work with sample data uploaded in elasticsearch. Thus, for now let us see how to start elasticsearch and kibana. For this, go to the folder where Kibana is unpacked.
For Windows
> cd kibanaproject/kibana-6.5.4/kibana-6.5.4/bin
> kibana
For Linux
$ cd kibanaproject/kibana-6.5.4/kibana-6.5.4/bin
$ kibana
Once Kibana starts, the user can see the following screen −
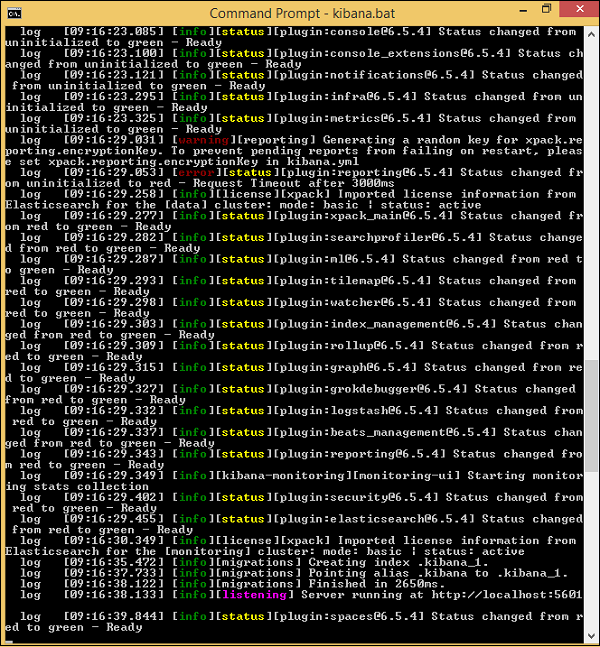
Once you see the ready signal in the console, you can open Kibana in browser using http://localhost:5601/.The default port on which kibana is available is 5601.
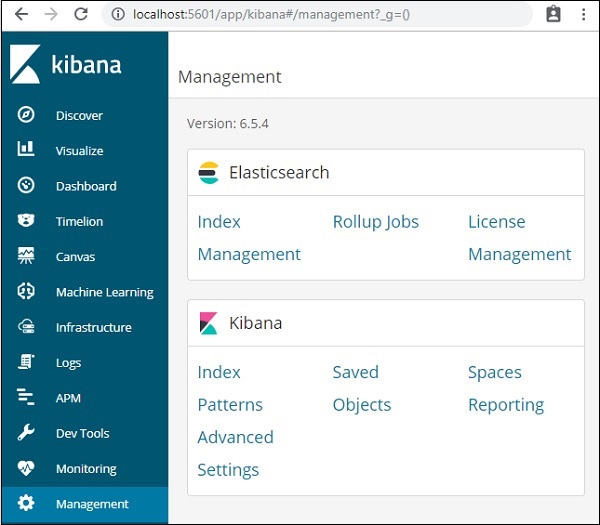
The user interface of Kibana is as shown here −
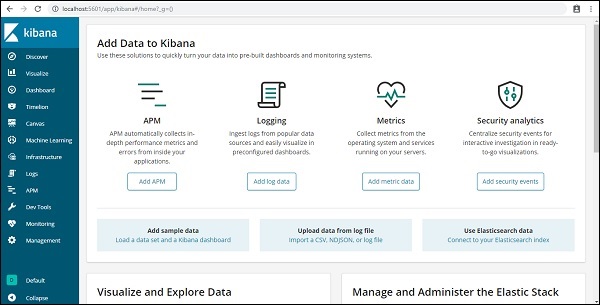
In our next chapter, we will learn how to use the UI of Kibana. To know the Kibana version on Kibana UI, go to Management Tab on left side and it will display you the Kibana version we are using currently.