- Intellij Idea - Home
- Intellij Idea - Introduction
- Installation and Configuration
- Intellij Idea − Getting Familiar
- Create First Java Project
- Intellij Idea − Deep Dive
- Intellij Idea − Deep Dive into Editor
- Intellij Idea − Code Refactoring
- Intellij Idea − Running Projects
- Intellij Idea − Build Tools
- Intellij Idea − Unit Testing
- Intellij Idea − Debugging
- Intellij Idea − Profiling
- Intellij Idea − Version Control
- Intellij Idea − Databases
- Migrating from NetBeans
- Intellij Idea − Migrating from Eclipse
Intellij Idea - Debugging
Debugger makes application debugging much easier. Using debugger, we can stop the execution of program at a certain point, inspect variables, step into function and do many things. IntelliJ provides inbuilt Java debugger.
Breakpoints
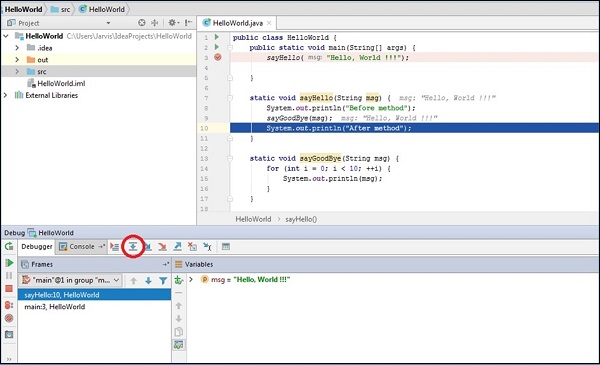
Breakpoint allows stopping program execution at certain point. Breakpoints can be set by hovering the mouse over the Editors gutter area and clicking on it.
Breakpoints are denoted using red circle symbols. Consider the breakpoint set at line 3.
Consider the following steps to understand more on how the breakpoints work −
Right-click on the red circle symbol.
Select the More options.
To remove breakpoint just click on same symbol.
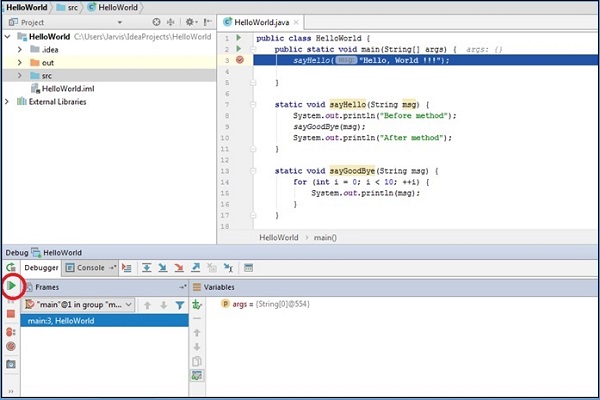
Follow these steps to start the debugger −
- Navigate to the Run menu.
- Select the Debug option.
Step into
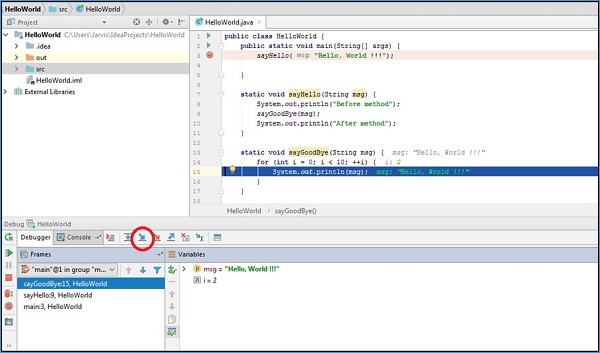
While debugging, if a function is encountered and a step into action is selected, then debugger will stop program execution at each point of that function as if debugging is enabled for that function.
For instance, when program execution reaches at line 9 and if we select the step into action then it stops the execution at each line in the sayGoodBye() function.
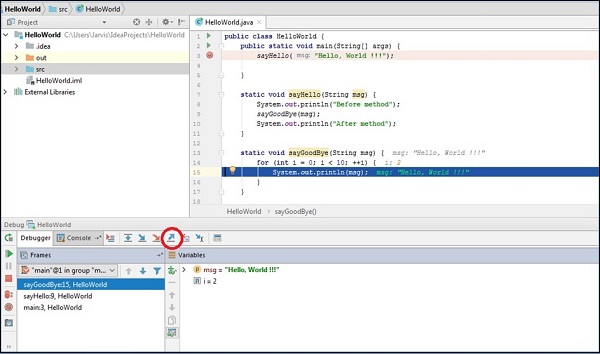
Step out
The Step out action is exactly the reverse of Step in action. For instance, if you perform the step out action with the above scenario then debugger will return from the sayGoodBye() method and start execution at line 10.
Step over
The Step over action does not enter into function instead, it will jump to the next line of code. For instance, if you are at line 9 and execute the step over action then it will move execution to line 10.
Resume Program
The Resume Program action will continue execution of program by ignoring all breakpoints.
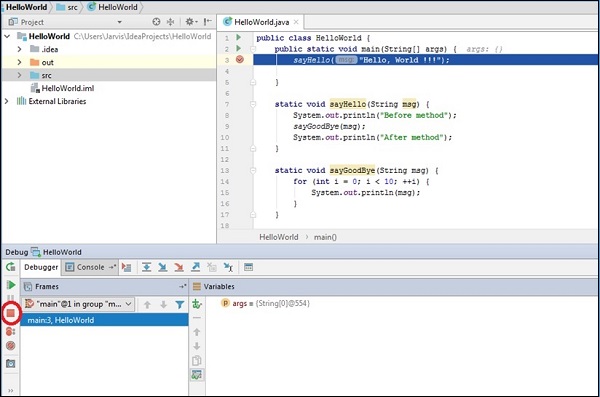
Stop action
The Stop action helps stop the debugger.
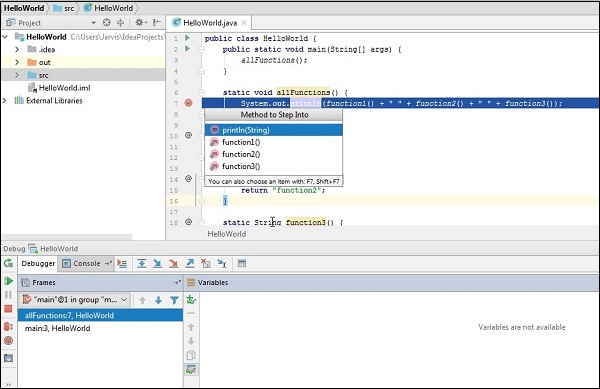
Smart step into
While debugging, we may sometimes reach a line of code that calls several methods. When debugging these lines of code, the debugger typically allows us to use step into and leads us through all child functions and then back to the parent function. However, what if we only wanted to step into one child function? With Smart step-into, it allows us to choose the function to step into.
Now, let us create a Java class with the following line of code −
public class HelloWorld {
   public static void main(String[] args) {
      allFunctions();
   }
   static void allFunctions() {
      System.out.println(function1() + " " + function2() + " " + function3());
   }
   static String function1() {
      return "function1";
   }
   static String function2() {
      return "function2";
   }
   static String function3() {
      return "function3";
   }
}
In the above code, allFunctions() calls 3 more functions. Let us set the breakpoint at this function. Follow these steps to perform smart step into −
- Go to run
- Select smart step into.
- Select the child function to go.
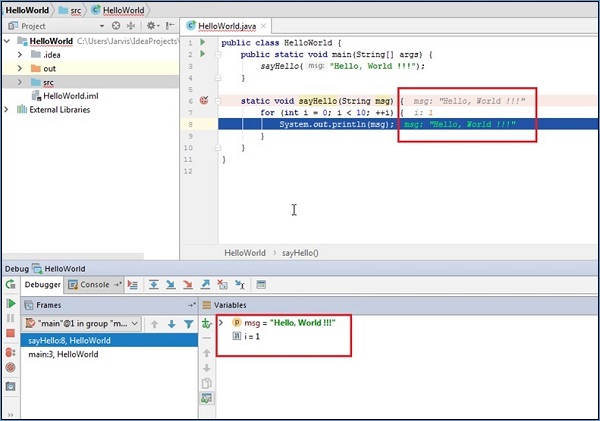
Inspecting variables
During debugging, IntelliJ shows value of variable in the Editor window itself. We can also view the same information in the Debug window.
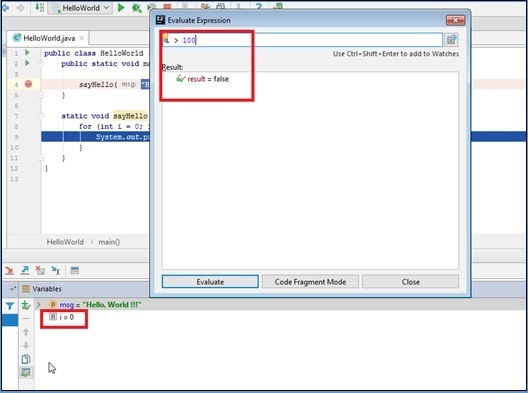
Evaluate expression
Evaluate expression allows to evaluate expression on the fly. Follow these steps to perform this action −
Start application in debugger
Navigate to Run->Evaluate expression.
Enter expression. In the example given below, the current value of variable i is 0; hence, expression i > 100 will evaluate to false