
Article Categories
- All Categories
-
 Data Structure
-
 Networking
-
 RDBMS
RDBMS
-
 Operating System
-
 Java
Java
-
 MS Excel
-
 iOS
iOS
-
 HTML
HTML
-
 CSS
CSS
-
 Android
-
 Python
-
 C Programming
-
 C++
C++
-
 C#
C#
-
 MongoDB
-
 MySQL
MySQL
-
 Javascript
-
 PHP
PHP
-
 Economics & Finance
Selected Reading
How to represent X-axis label of a bar plot with greater than equal to or less than equal to sign using ggplot2 in R?
The values of the categorical variable can be represented by numbers, by characters, by a combination of numbers and characters, by special characters, by numerical signs or any other method. But when we create the bar plot, if the size of a label name is large then we might want to reduce it by representing it with a different word or character or sign that gives the same meaning and it can be done by using expression argument inside scale_x_discrete.
Example
Consider the below data frame −
> x<-c("0","100","150","200","Greater than 200")
> y<-c(25,28,32,25,37)
> df<-data.frame(x,y)
> df
Output
   x  y
1 0   25
2 100 28
3 150 32
4 200 25
5 Greater than 200 37
Creating the bar plot −
> library(ggplot2)
> ggplot(df,aes(x,y))+geom_bar(stat="identity")
Output
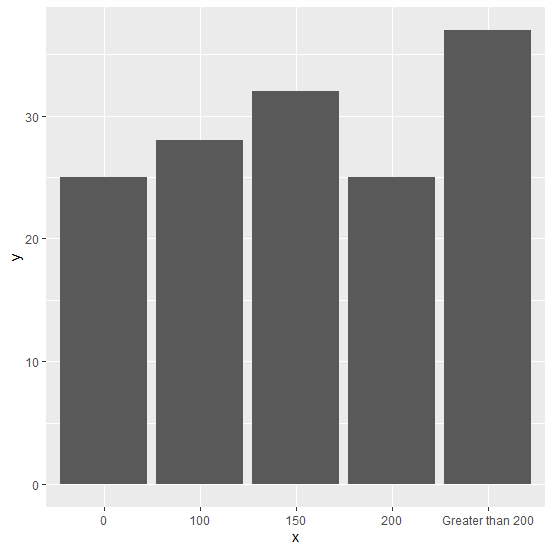
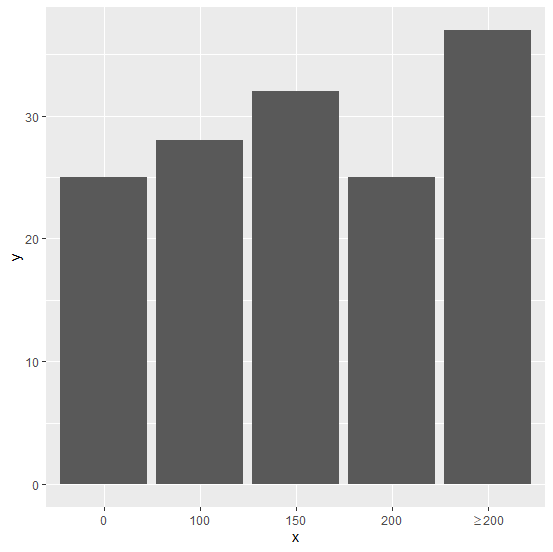
Now suppose, you want to replace “Greater than 200” with >=200 then it can be done as shown below −
> ggplot(df,aes(x,y))+geom_bar(stat="identity")+
+ scale_x_discrete(labels=c("0","100","150","200",expression("">=200)))

Updated on: 2026-03-11T22:50:51+05:30
1K+ Views

Advertisements