
Article Categories
- All Categories
-
 Data Structure
-
 Networking
-
 RDBMS
RDBMS
-
 Operating System
-
 Java
Java
-
 MS Excel
-
 iOS
iOS
-
 HTML
HTML
-
 CSS
CSS
-
 Android
-
 Python
-
 C Programming
-
 C++
C++
-
 C#
C#
-
 MongoDB
-
 MySQL
MySQL
-
 Javascript
-
 PHP
PHP
-
 Economics & Finance
Selected Reading
How to remove grid lines from an image in Python Matplotlib?
To remove grid lines from an image in Python Matplotlib, you need to explicitly disable the grid using grid(False). By default, Matplotlib may show grid lines over images, which can interfere with image visualization.
Steps to Remove Grid Lines
- Set the figure size and adjust the padding between and around the subplots
- Load an image from a file
- Convert the image from one color space to another if needed
- To remove grid lines, use
ax.grid(False)orplt.grid(False) - Display the data as an image using
imshow() - Display the figure using
show()method
Example
Here's how to display an image without grid lines ?
from matplotlib import pyplot as plt
import cv2

plt.rcParams["figure.figsize"] = [7.50, 3.50]
plt.rcParams["figure.autolayout"] = True

img = cv2.imread('bird.jpg')
img = cv2.cvtColor(img, cv2.COLOR_BGR2RGB)

plt.grid(False)
plt.imshow(img)

plt.show()
Alternative Method Using Axes Object
You can also control grid lines using the axes object directly ?
from matplotlib import pyplot as plt
import cv2

fig, ax = plt.subplots(figsize=(7.50, 3.50))

img = cv2.imread('bird.jpg')
img = cv2.cvtColor(img, cv2.COLOR_BGR2RGB)

ax.grid(False)
ax.imshow(img)

plt.show()
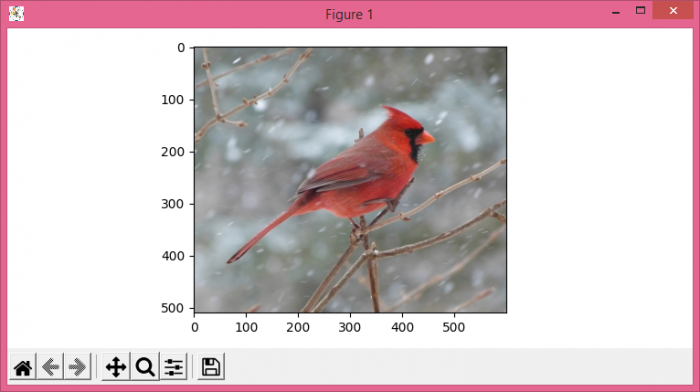
Output
Key Points
-
plt.grid(False)disables grid lines for the current axes -
ax.grid(False)provides more explicit control when working with multiple subplots - Grid lines are typically unwanted when displaying images as they can obscure image details
- The
cv2.cvtColor()function converts BGR format (OpenCV default) to RGB format (Matplotlib default)
Conclusion
Use plt.grid(False) or ax.grid(False) to remove unwanted grid lines from image displays in Matplotlib. This ensures clean image visualization without visual interference from grid overlays.

Updated on: 2026-03-25T22:44:01+05:30
7K+ Views

Advertisements