
Article Categories
- All Categories
-
 Data Structure
-
 Networking
-
 RDBMS
RDBMS
-
 Operating System
-
 Java
Java
-
 MS Excel
-
 iOS
iOS
-
 HTML
HTML
-
 CSS
CSS
-
 Android
-
 Python
-
 C Programming
-
 C++
C++
-
 C#
C#
-
 MongoDB
-
 MySQL
MySQL
-
 Javascript
-
 PHP
PHP
-
 Economics & Finance
Selected Reading
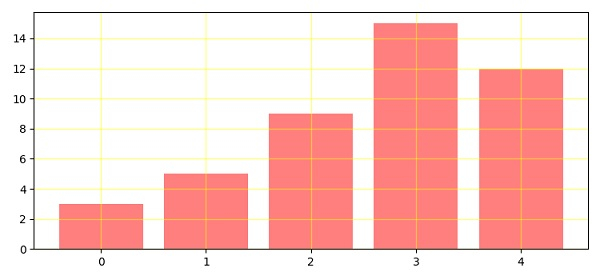
How to draw grid lines behind Matplotlib bar graph?
To draw grid lines behind matplotlib bar graph, we can take the following Steps −
Make a list of numbers, i.e., data.
Make a bar using the bar() method, by passing data, color='red' and alpha = 0.5. The alpha blending value should be between 0 (transparent) and 1 (opaque).
To configure the grid lines, use the grid() method, with color='yellow', linewidth=1, axis='both' and alpha=0.5.
To display the figure, show() method.
Example
from matplotlib import pyplot as plt
plt.rcParams["figure.figsize"] = [7.50, 3.50]
plt.rcParams["figure.autolayout"] = True
data = [3, 5, 9, 15, 12]
plt.bar(range(len(data)), data, color='red', alpha=0.5)
plt.grid(color='yellow', linewidth=1, axis='both', alpha=0.5)
plt.show()
Output

Updated on: 2021-04-09T12:29:26+05:30
3K+ Views

Advertisements