
Article Categories
- All Categories
-
 Data Structure
-
 Networking
-
 RDBMS
RDBMS
-
 Operating System
-
 Java
Java
-
 MS Excel
-
 iOS
iOS
-
 HTML
HTML
-
 CSS
CSS
-
 Android
-
 Python
-
 C Programming
-
 C++
C++
-
 C#
C#
-
 MongoDB
-
 MySQL
MySQL
-
 Javascript
-
 PHP
PHP
-
 Economics & Finance
How to Add Grid Lines in MATLAB
MATLAB provides various options to control the visibility of gridlines in a plot. By using these options, we can display or hide both major and minor grid lines.
Gridline Control Options
MATLAB has the a "grid" option that can accept three control values, i.e. "on", "off", and "minor" to control the visibility of gridlines in a plot. The "grid" option with value "on" displays the major grid lines in the plot, with value "off" hides the gridlines in plot, and with value "minor" it can display minor gridlines in the plot.
It is important to note that when the "grid" option is not specified in a MATLAB program, then it is equivalent to "grid off", i.e. hides all the gridlines in the plot.
Syntax
grid option;
Here, the "option" can be either "on" or "off" or "minor".
Example
The following MATLAB program illustrates the use of "grid" option to display the major gridlines in the plot.
% MATLAB program to display major gridlines on the plot
% Create sample data vectors
x = linspace(1, 5, 5);
y = x.^2;
% Plot the x and y data on graph
plot(x, y);
% Display grid lines
grid on;
Output
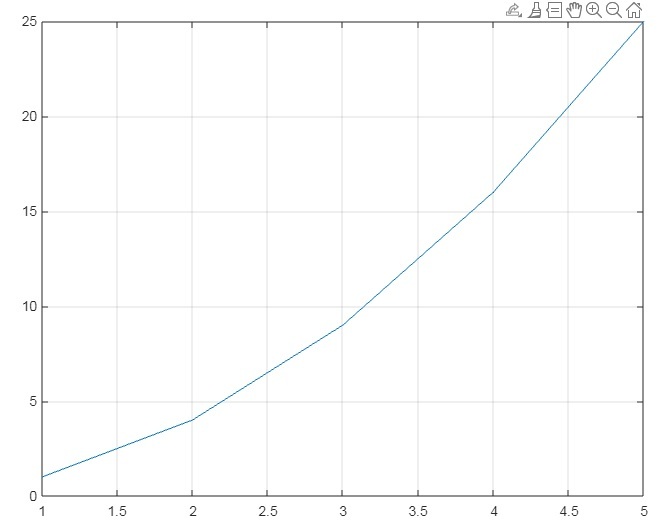
Explanation
In the above MATLAB program, we start by creating sample data and store them in variables "x" and "y". After that we call the "plot()" function to plot the graph for data stored in "x" and "y". Finally, we use the "grid" option with "on" value to display the major gridlines in the plot area.
Example
% MATLAB program to display major and minor gridlines in the plot
% Create sample data vectors
x = linspace(1, 5, 5);
y = x.^2;
% Plot the x and y data on graph
plot(x, y);
% Display grid lines
grid on;
grid minor;
Output
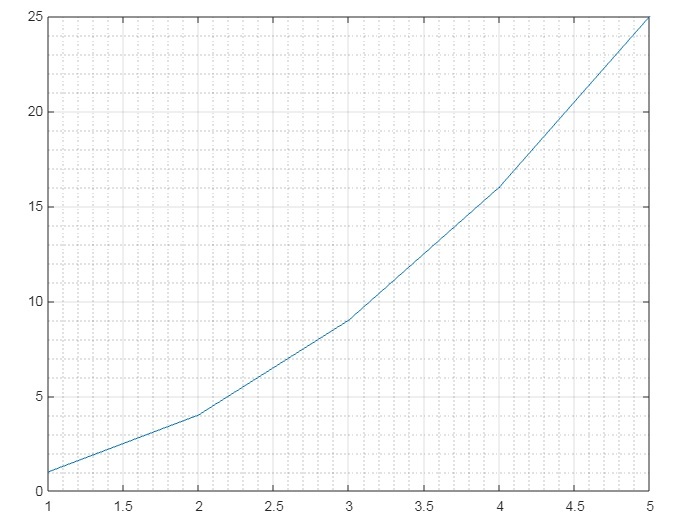
Explanation
In this MATLAB program, first we create sample data and store them in variables "x" and "y". After that we call the "plot()"function to plot the graph of data stored in "x" and "y". Finally, we use the "grid" option with "on" and "minor" values to display the major as well as minor gridlines in the plot area.
This is how we can control the visibility of major and minor gridlines in a plot using MATLAB's "grid" function.

2K+ Views
